All your meters in one workspace.
Every meter you manage, in one place. On its own, per location, or per customer. For a handful of meters or several hundred alike.
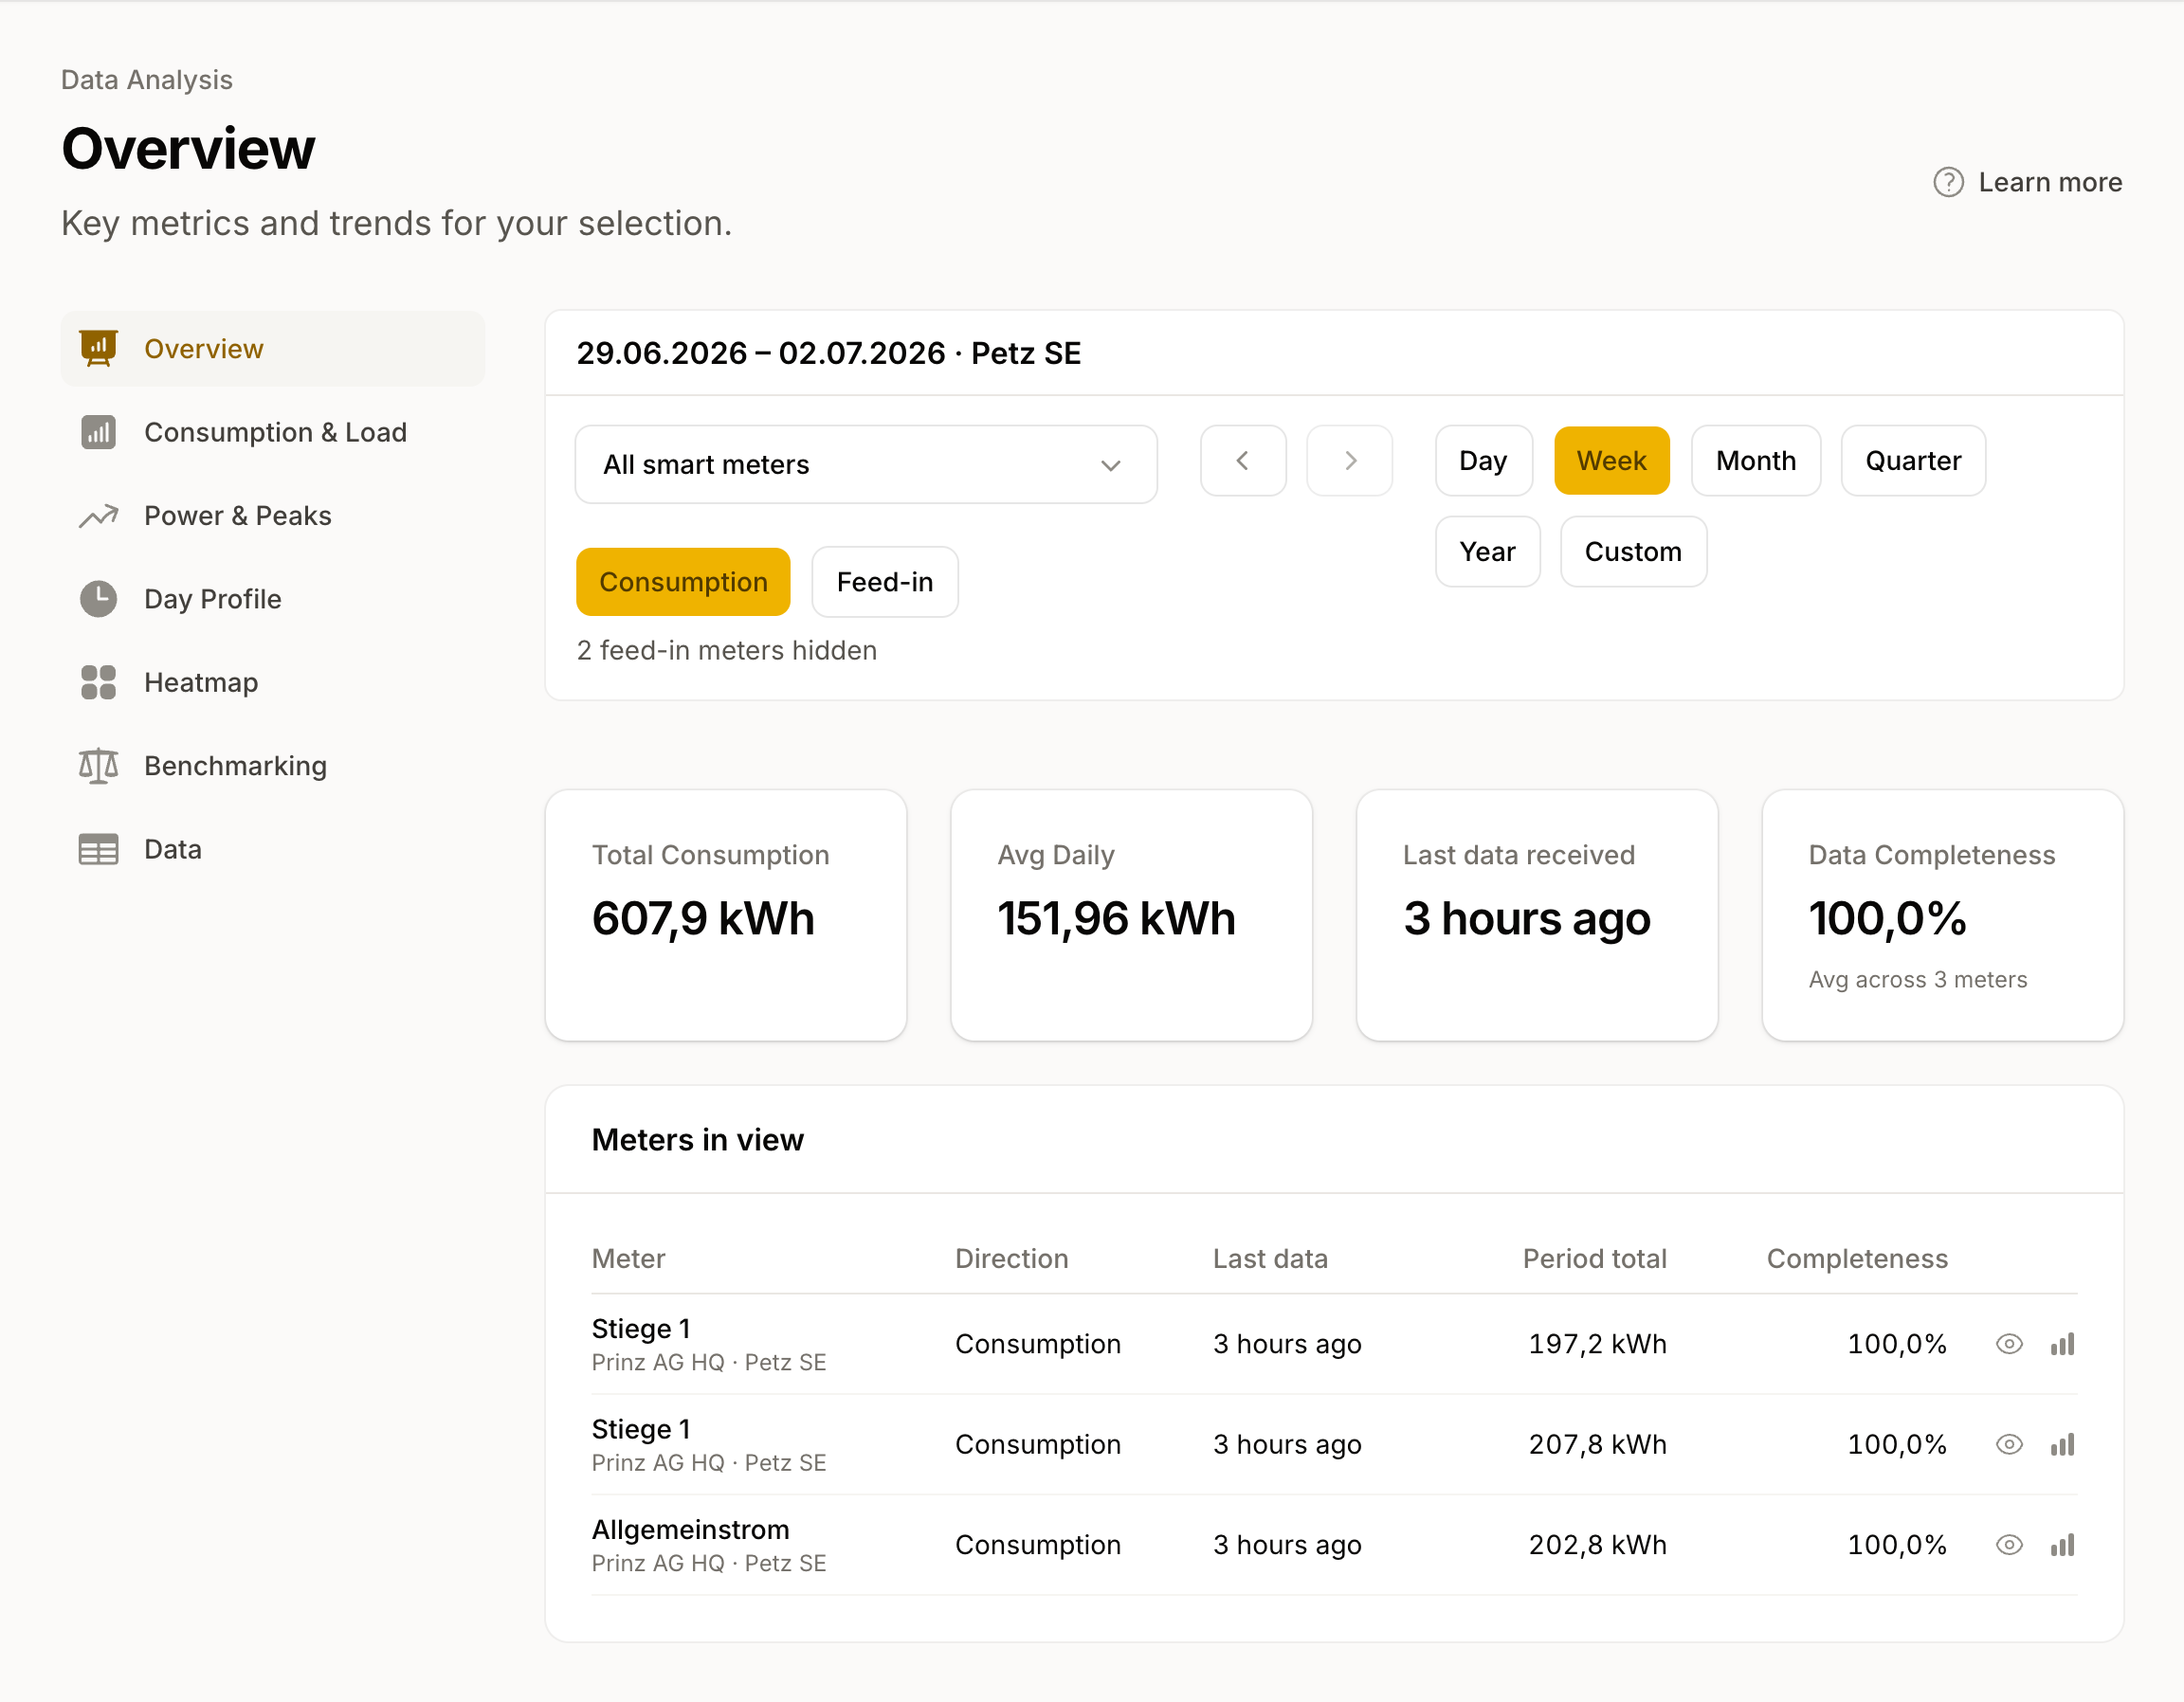
How you work with your portfolio
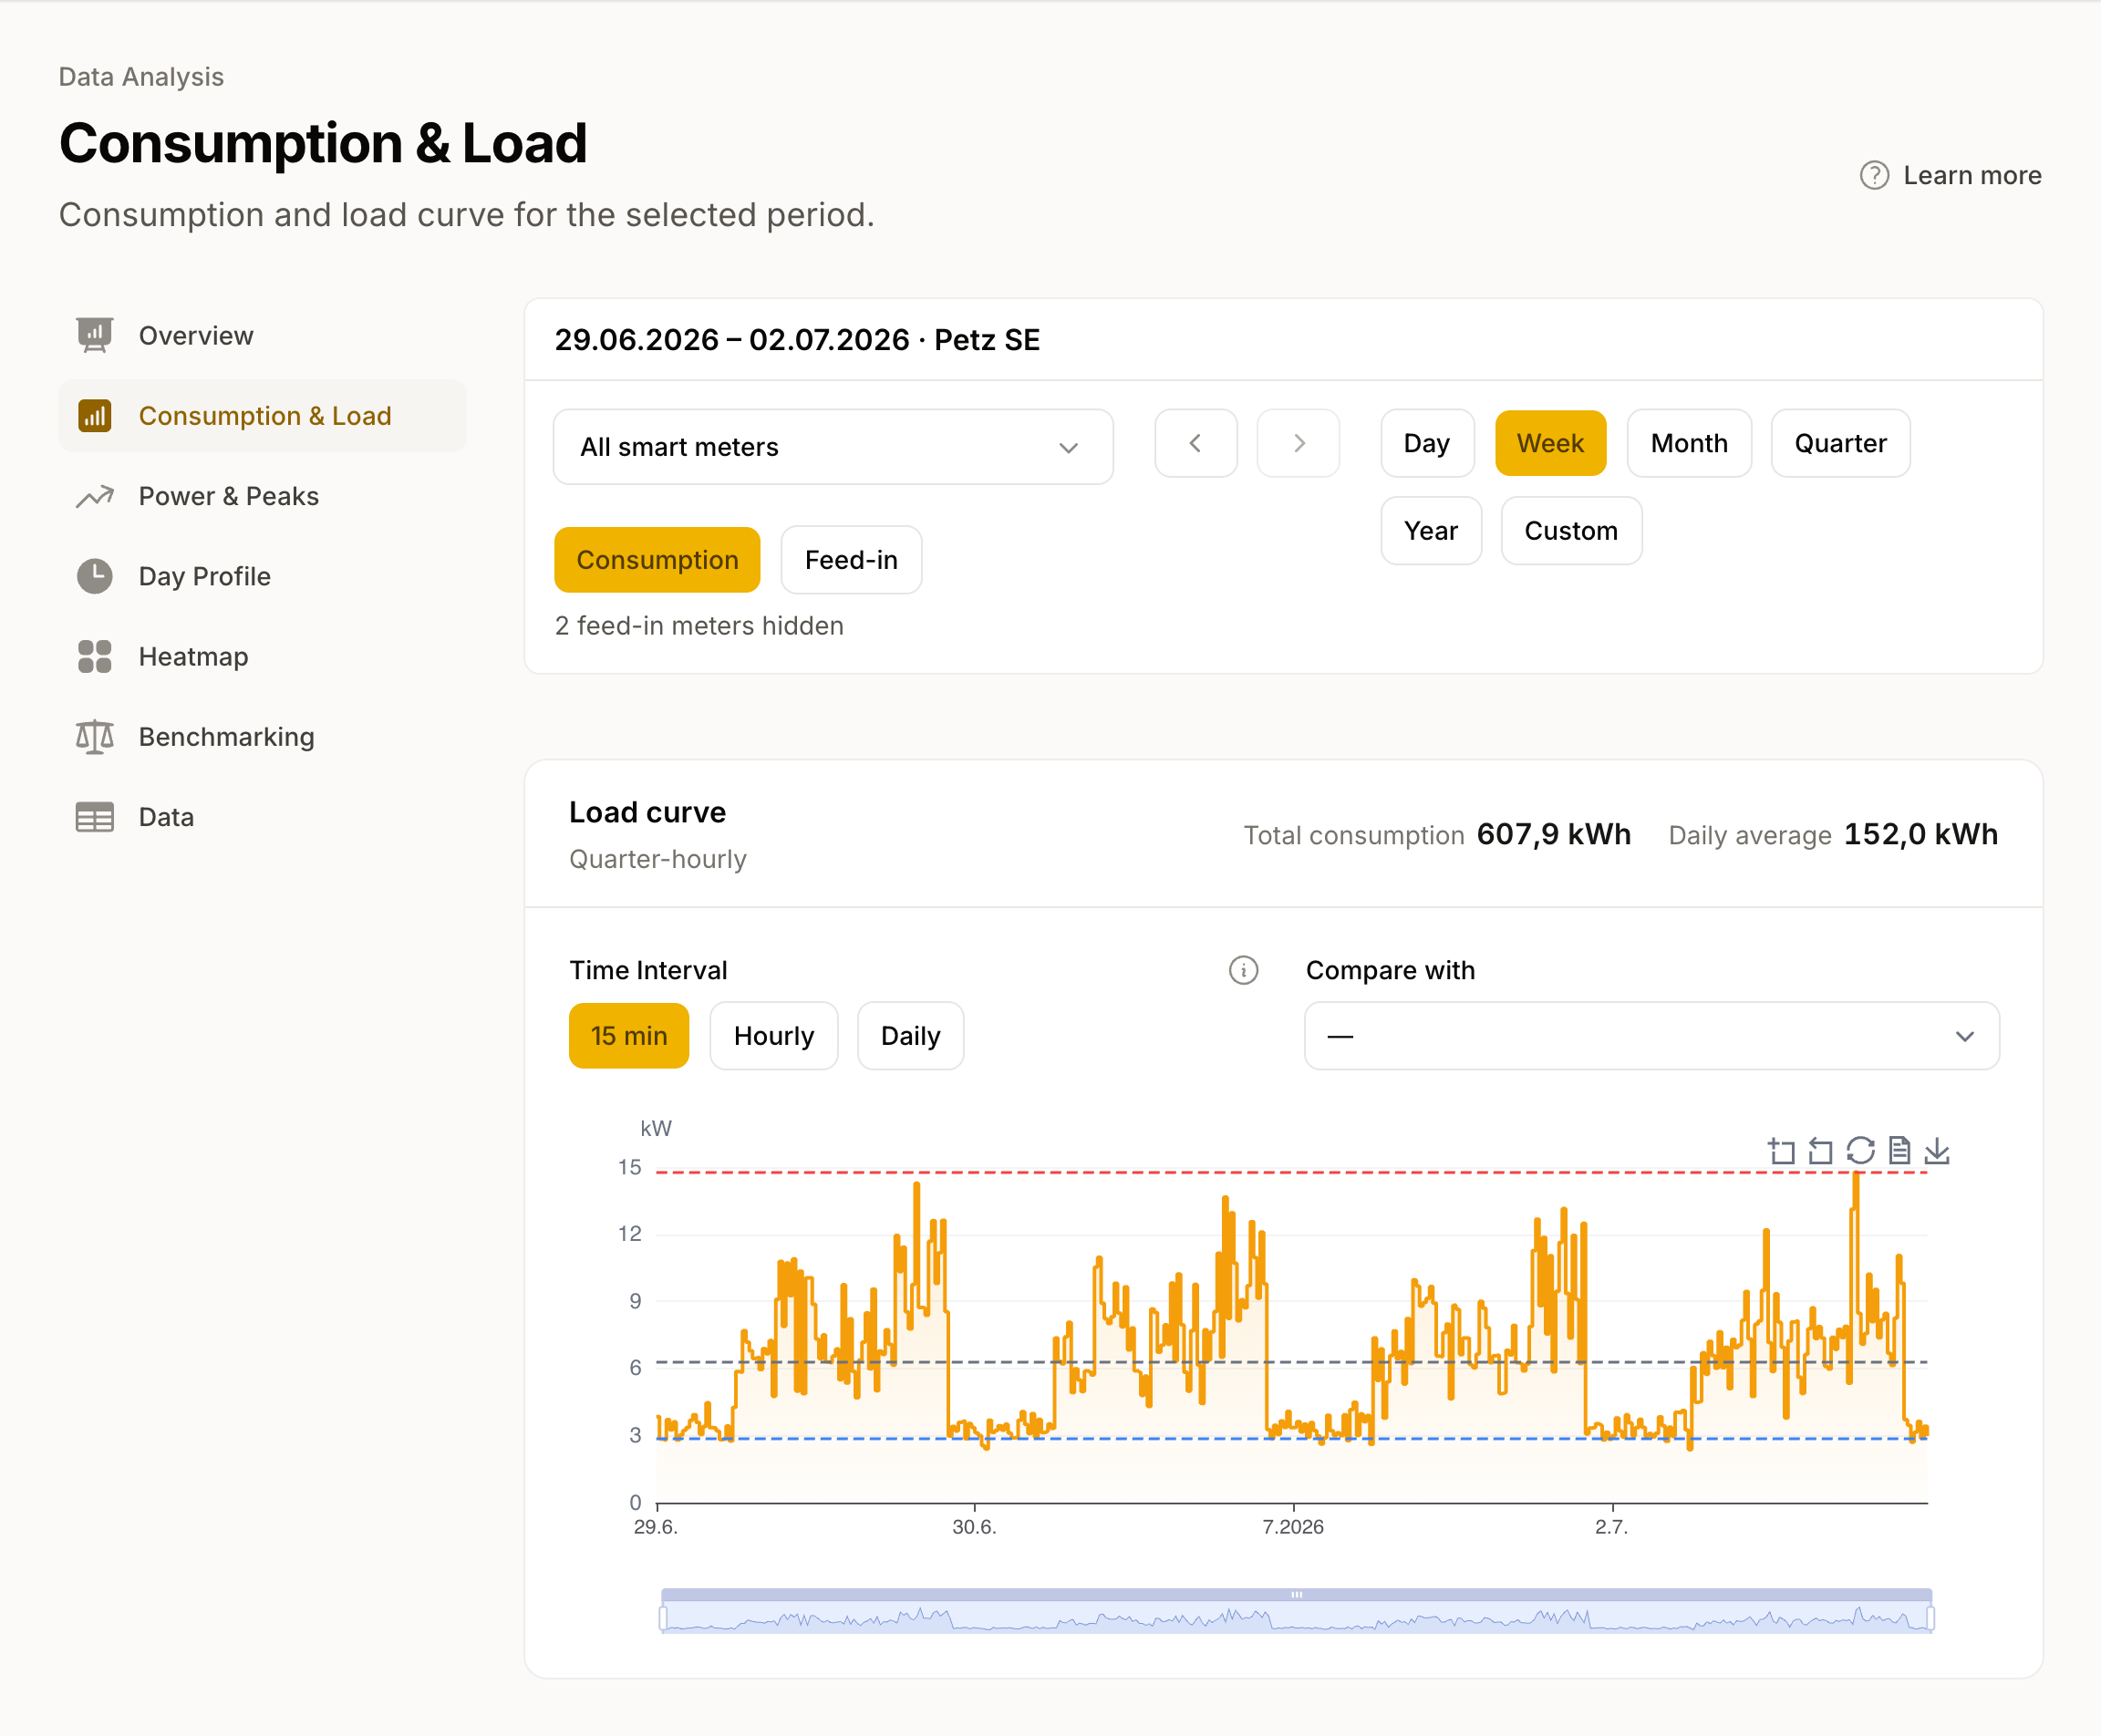
One customer or one location as a single curve
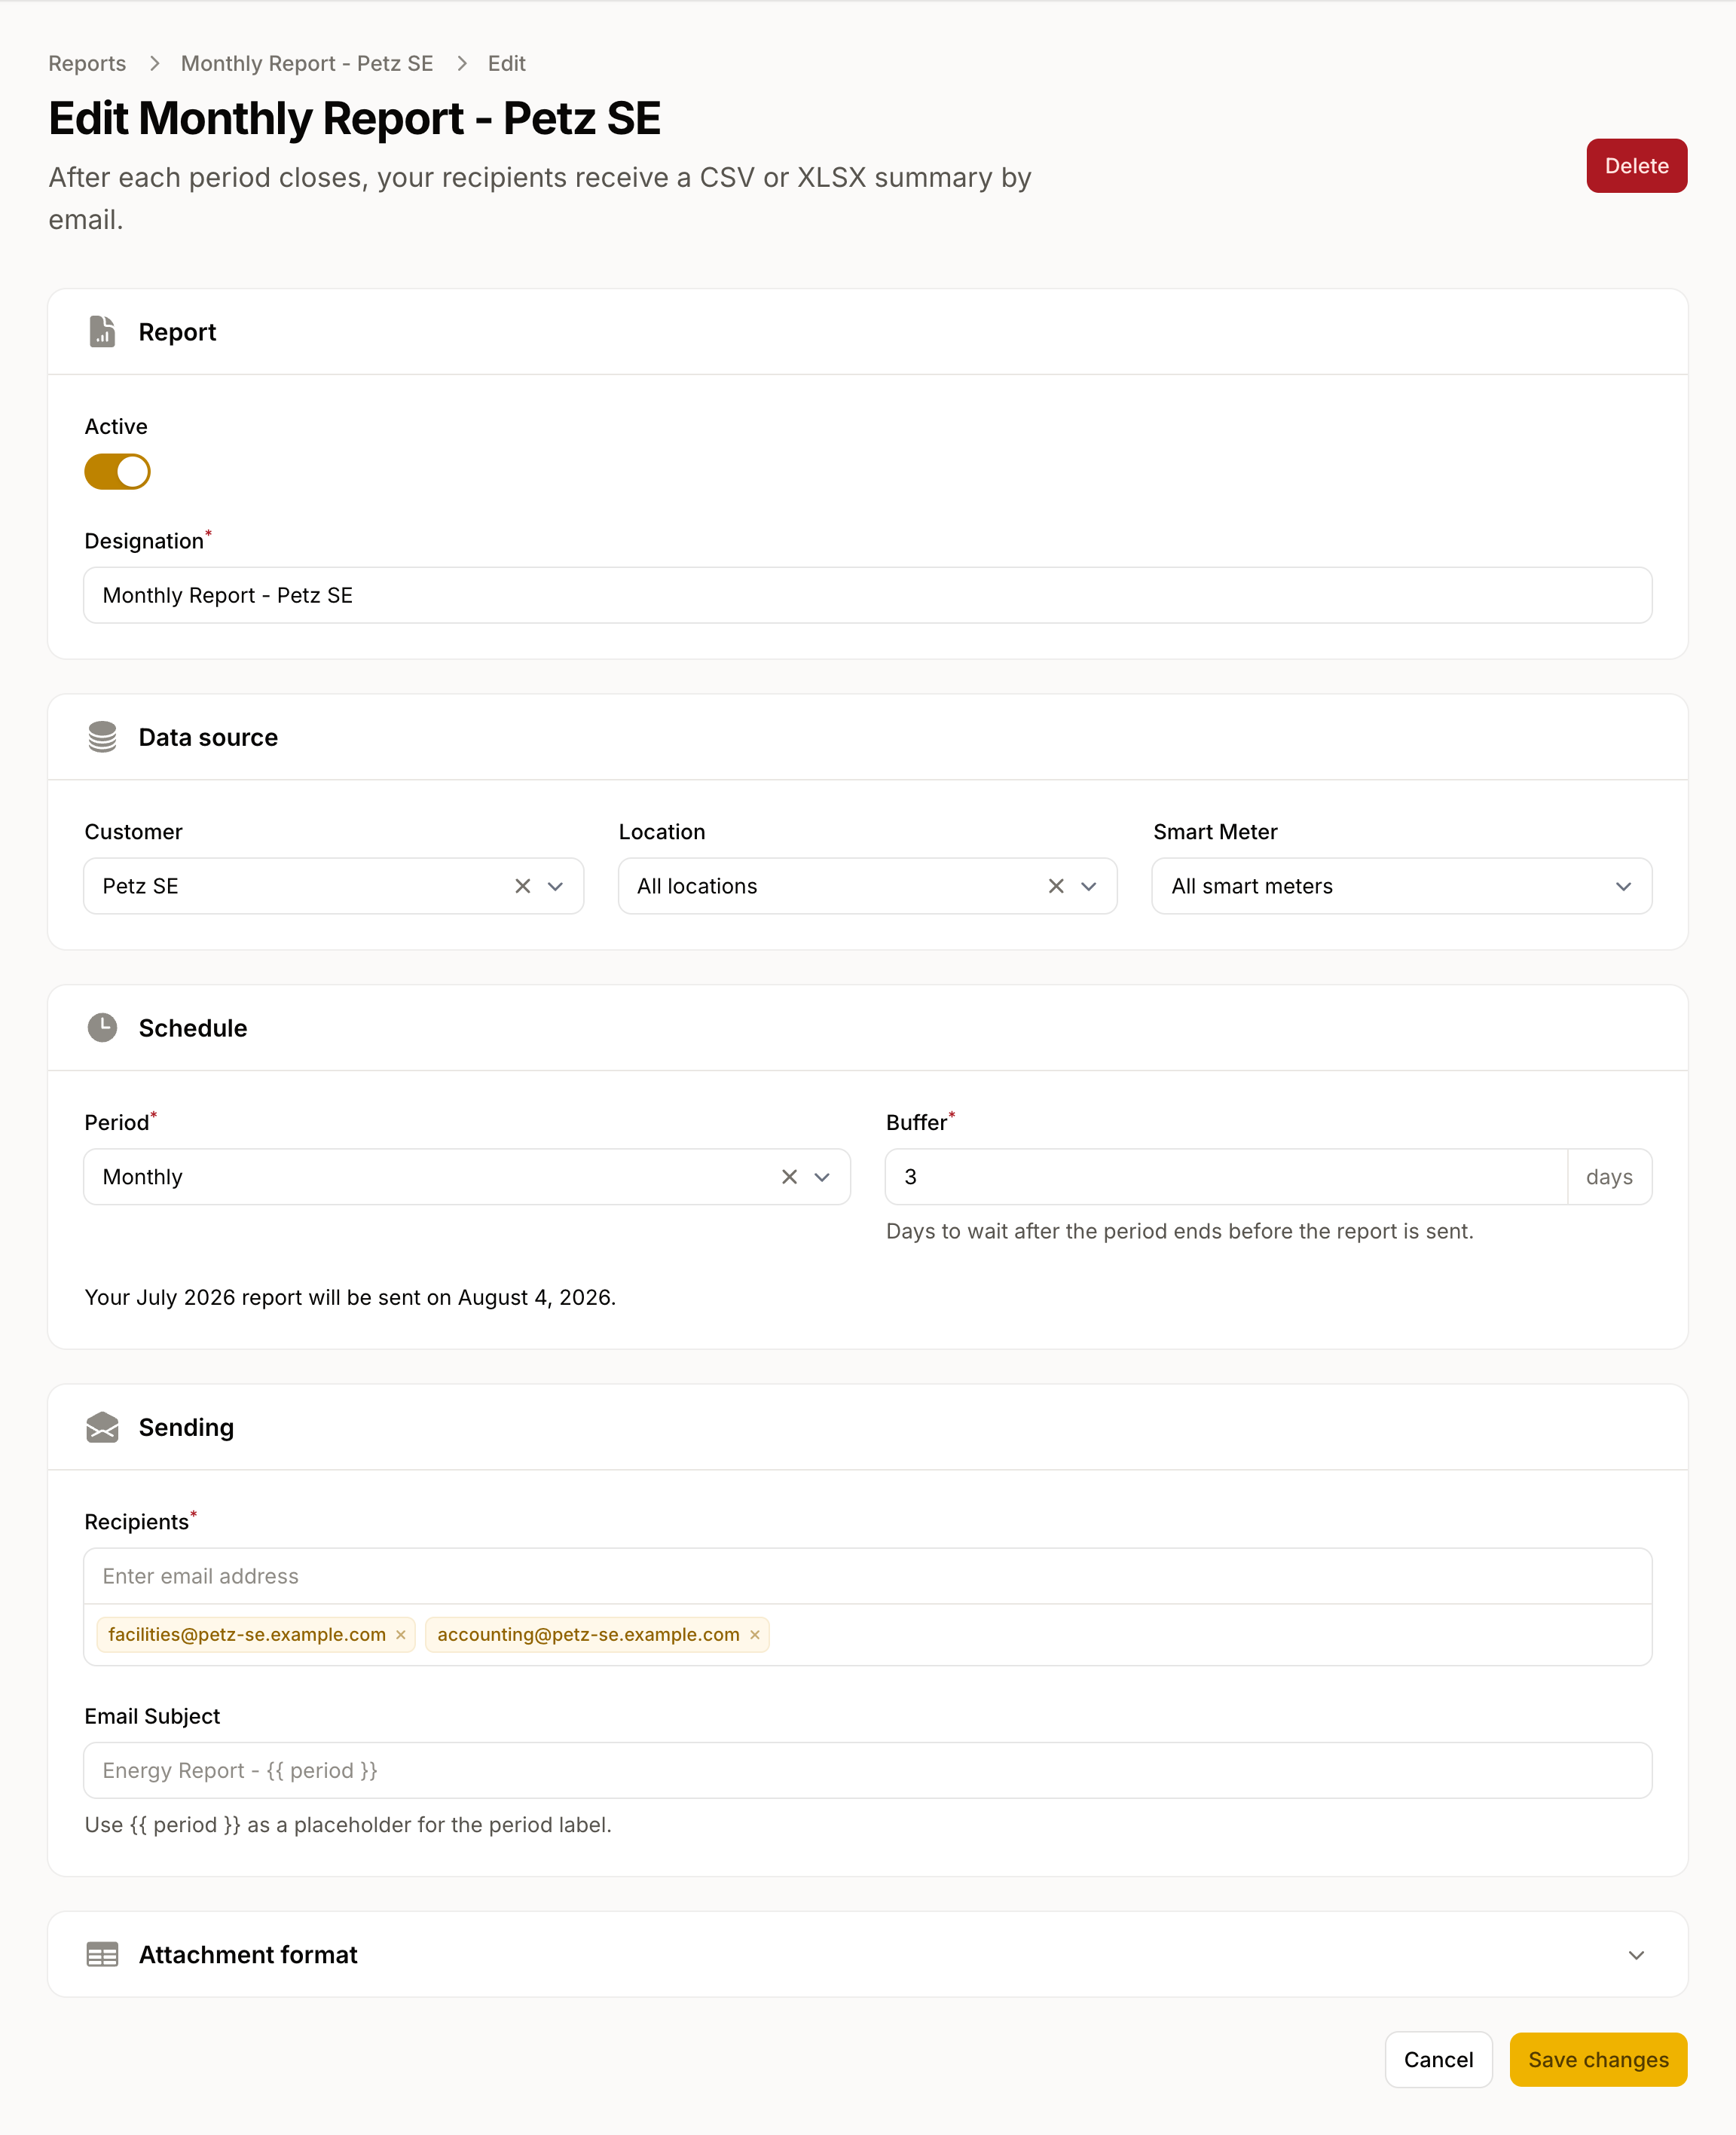
A scheduled export for every customer and location
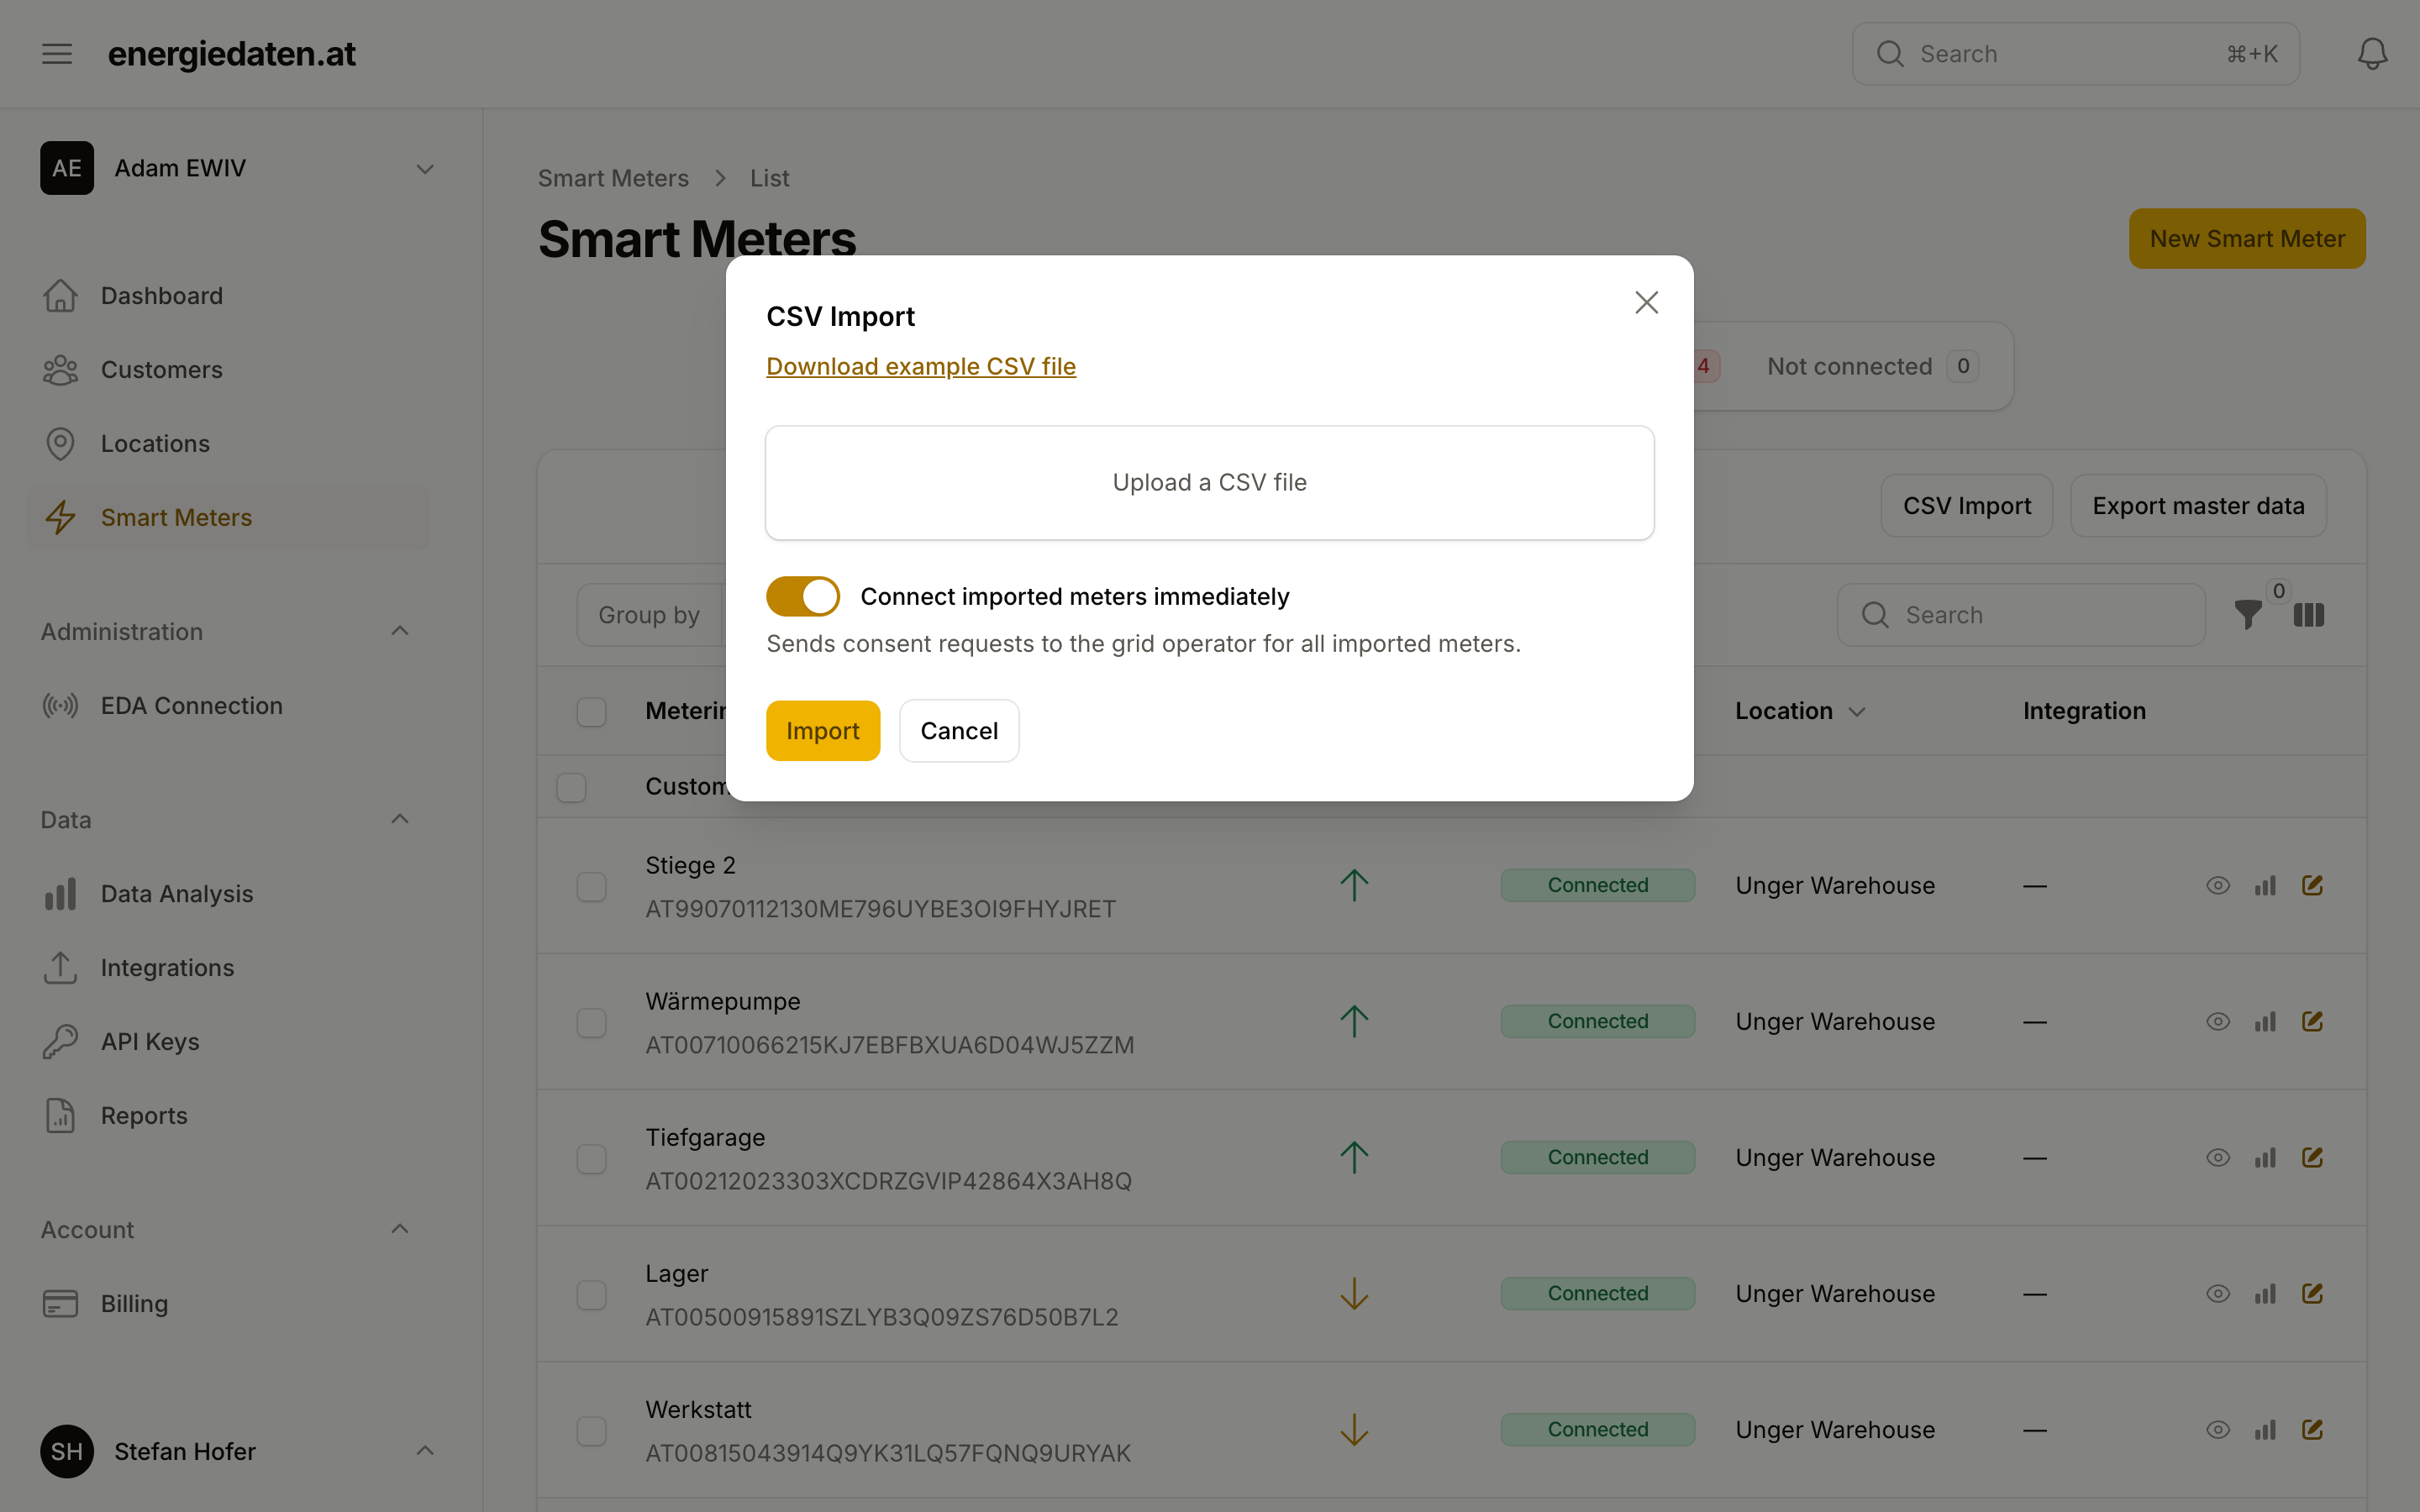
A whole portfolio from one file
Consumption and feed-in at every level
Frequently asked questions
- I don't manage customers, only my own locations. Does this fit?
- Yes. The customer view is optional. Your locations stand on their own, and nothing forces the customer concept on you. Own portfolio shows exactly those locations.
- Can my customers see the data?
- No. A customer is an entry in your workspace that you use to group meters. It is not a user account: your customers have no access and do not see the data.
- Do I have to enter an existing portfolio by hand?
- No. You bring it in by file import, instead of adding each meter one at a time.
More features
Smart Meter Data
Daily consumption data from all 140+ Austrian grid areas. Data request, consent, 15-minute values, and a unified format from a single source.
Integrations
Smart meter electricity data in the systems your team works in: portfolio management, ERP, energy management, solar asset management, or your own dashboards.
Energy Analysis
Base load, peaks, patterns and benchmarks directly on the platform: analyse 15-minute values for consumption and feed-in, check the quality of every value, take a CSV with you.
AI connections (MCP)
Explore electricity consumption in your AI assistant. Compare load patterns, investigate demand peaks and connect your assistant directly from this page.
Energy data made easy
Smart meter consumption data via API, webhook, or CSV for all Austrian grid operators.
