Readings become answers: understand consumption and feed-in.
How much runs through at night? When do the peaks occur? What does the PV system feed in? Every connected metering point brings 15-minute values onto the platform, for consumption as well as feed-in. The answers live where the data arrives: as load profile, patterns, benchmark and verifiable raw values.
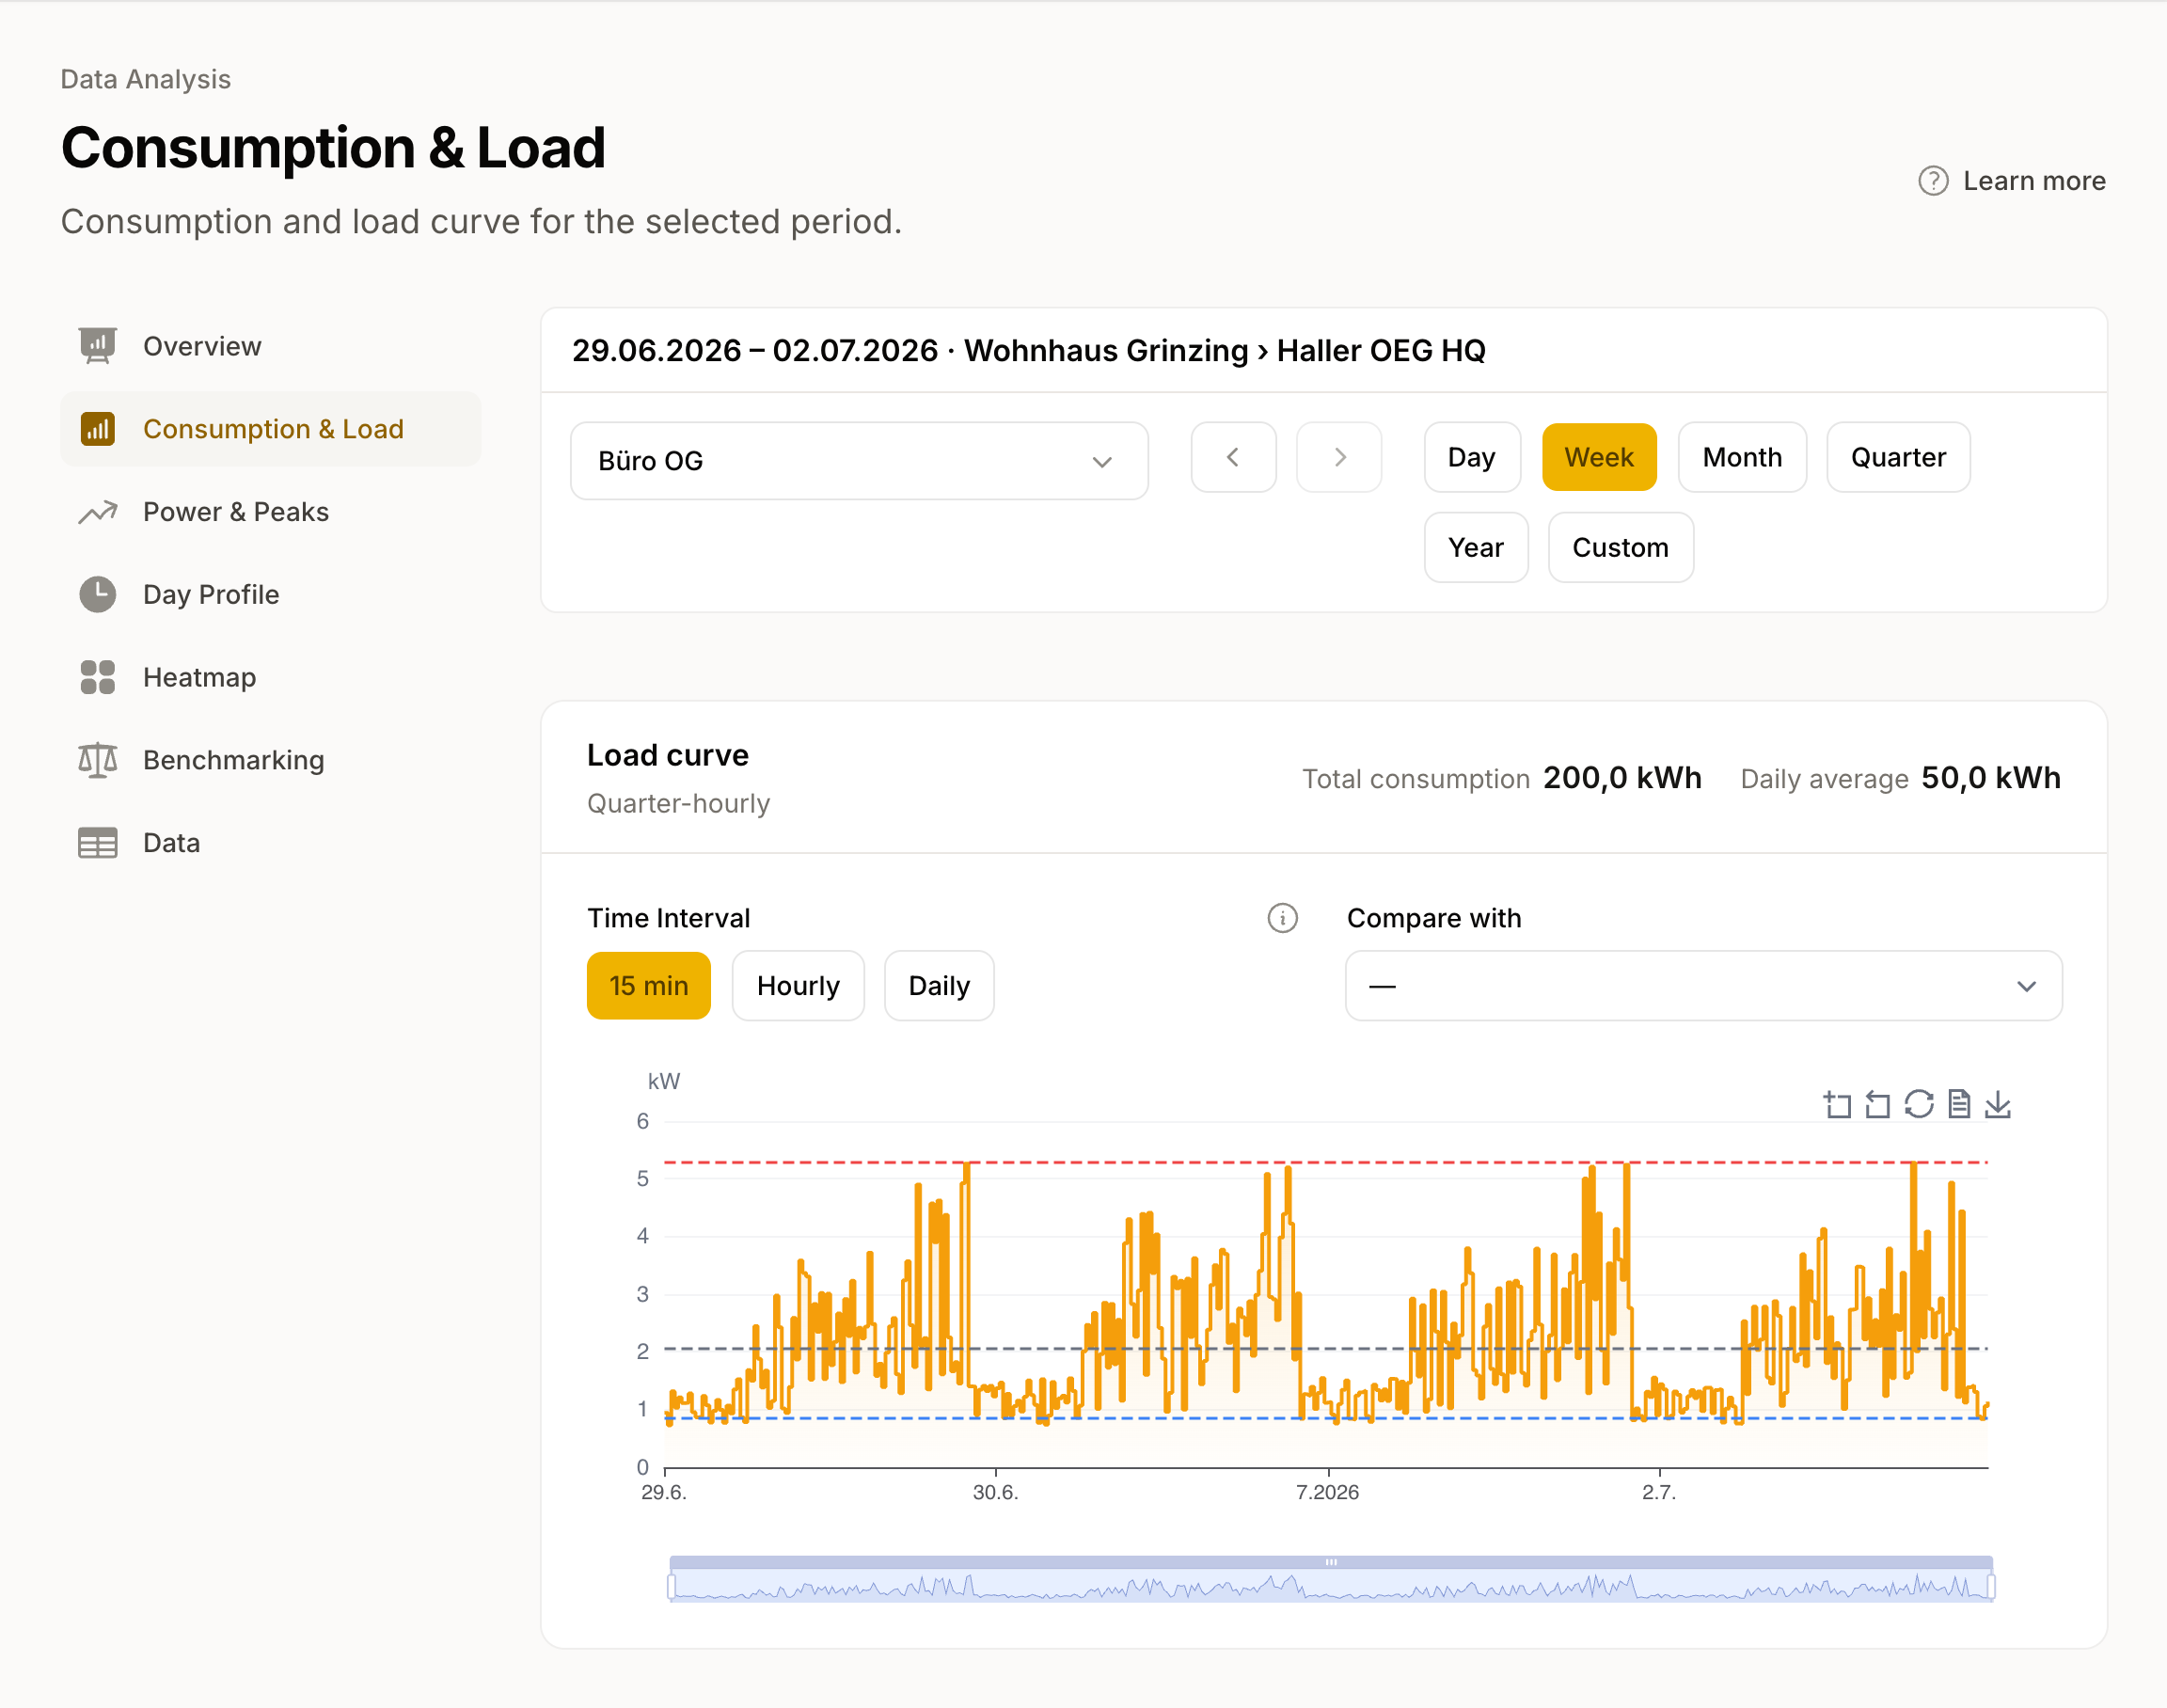
Every view answers a question
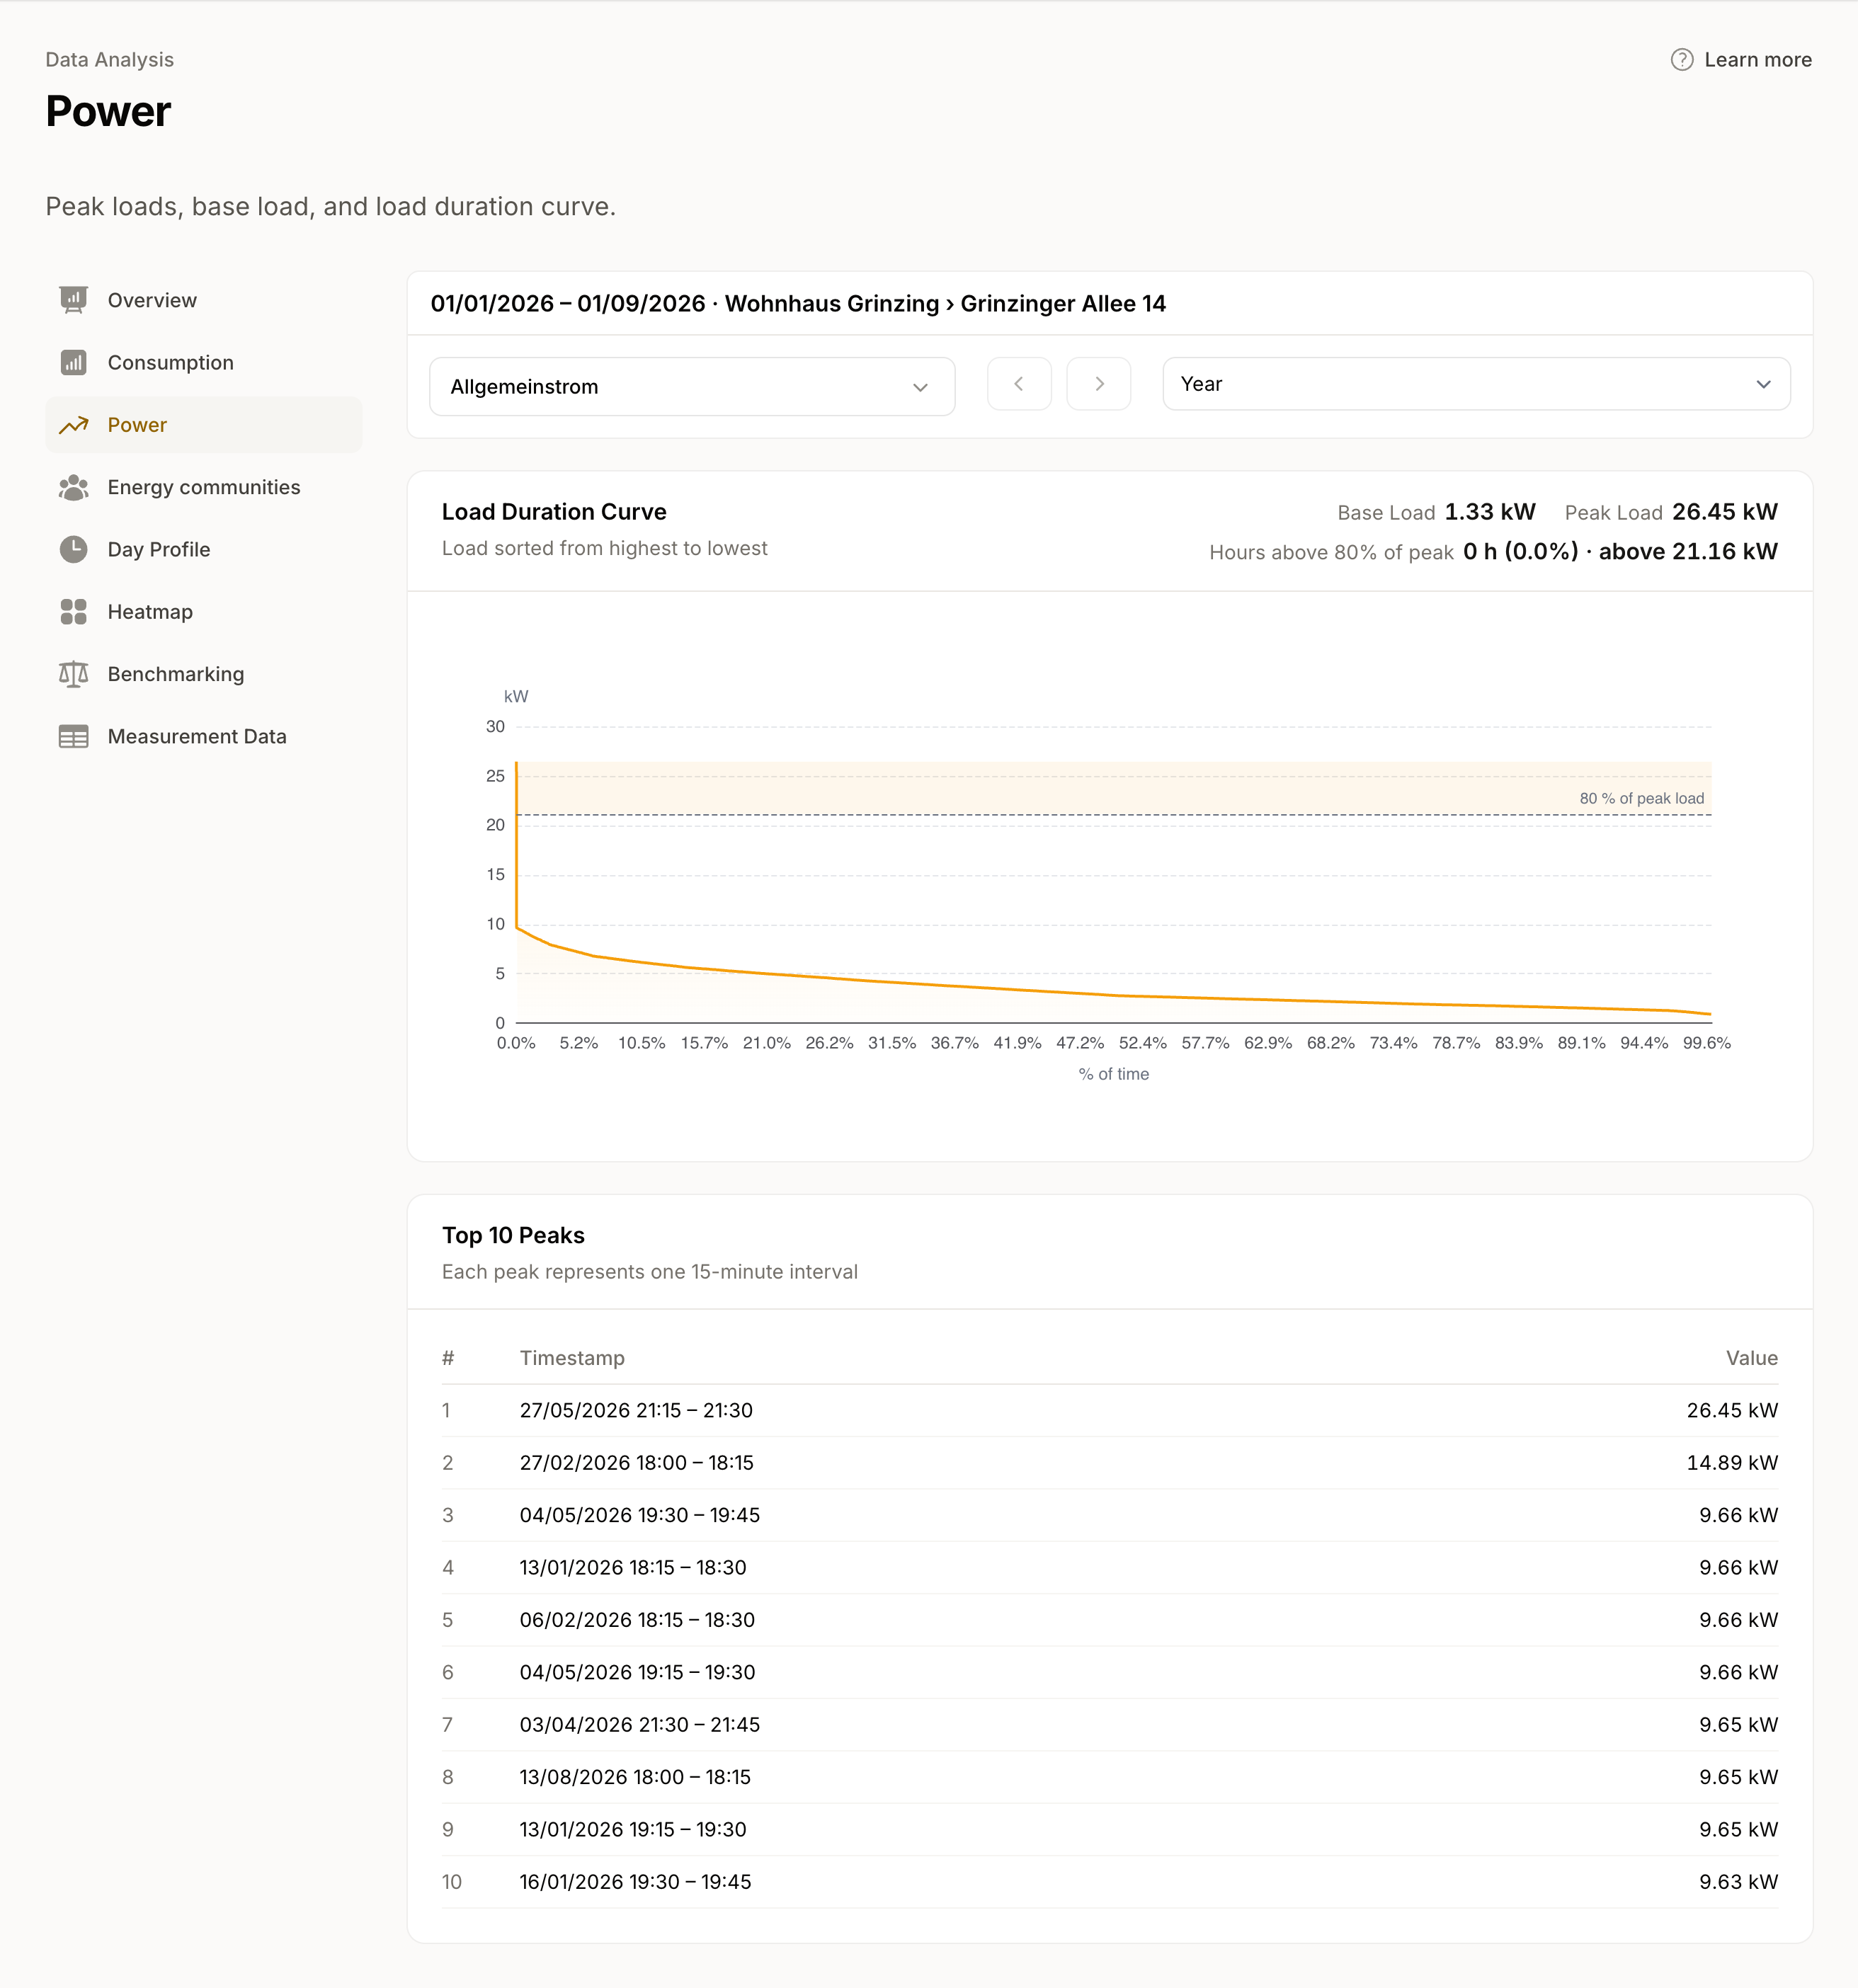
Spot base load and peaks
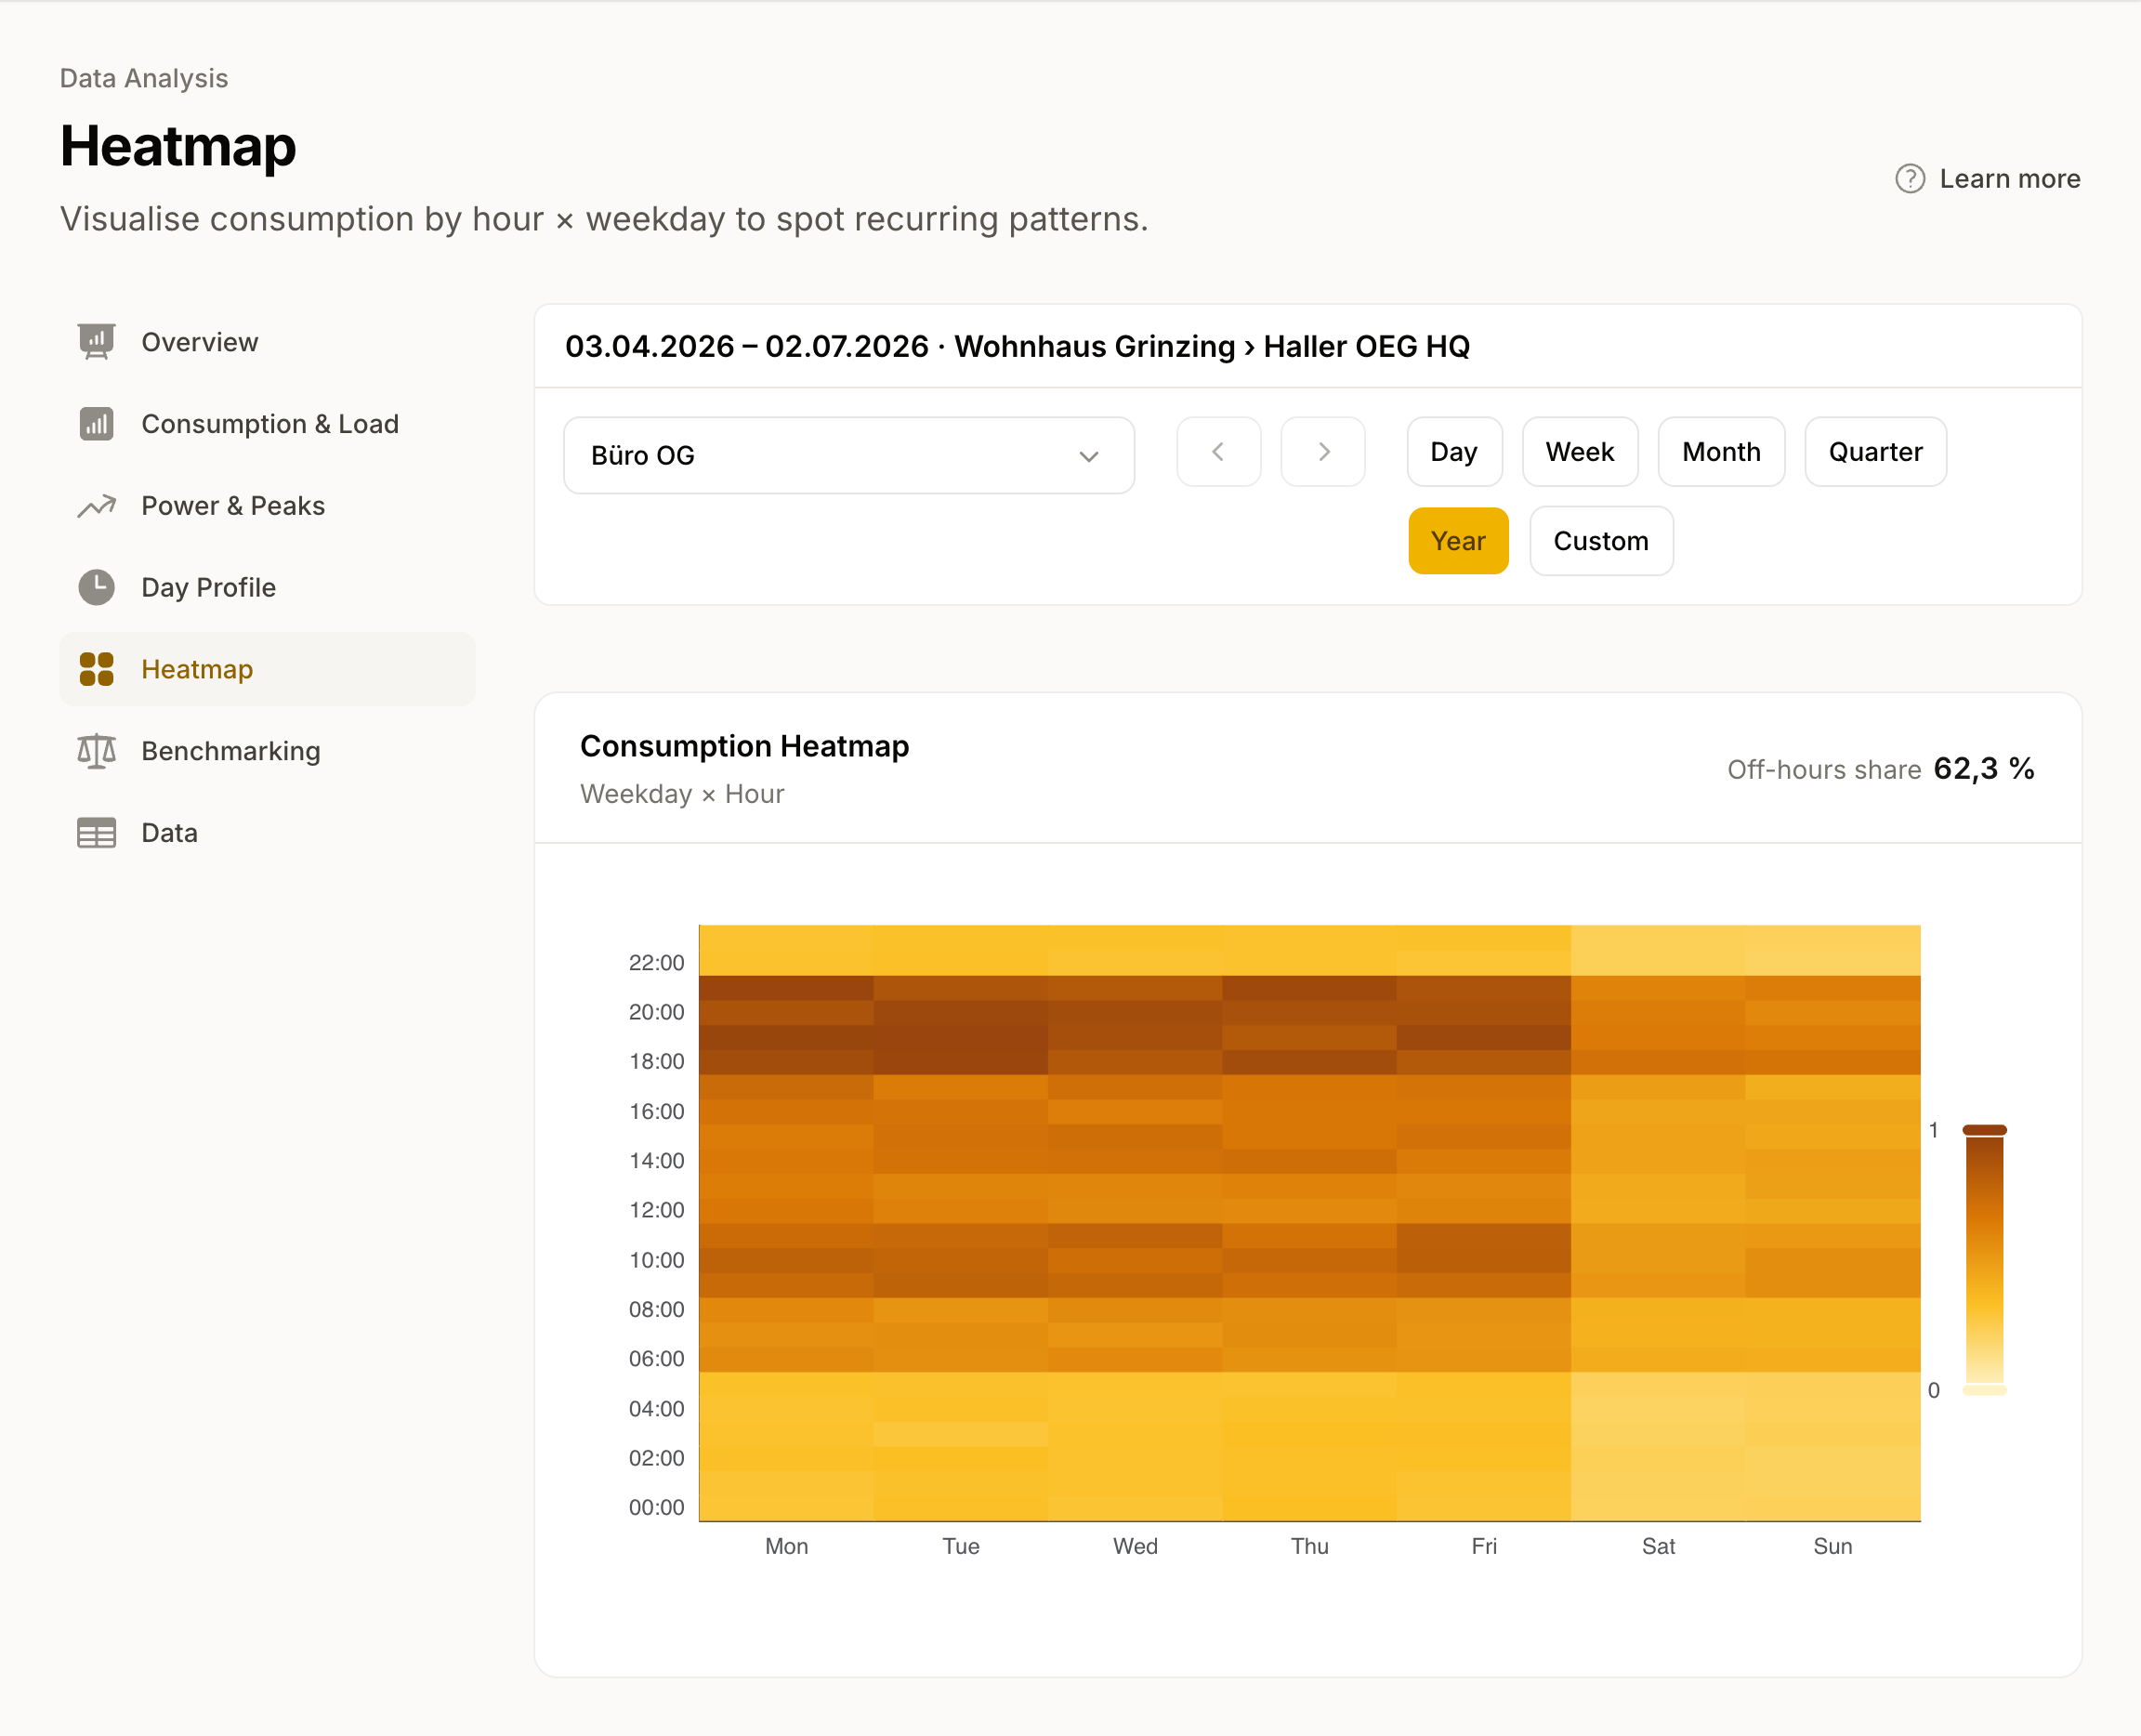
See the patterns
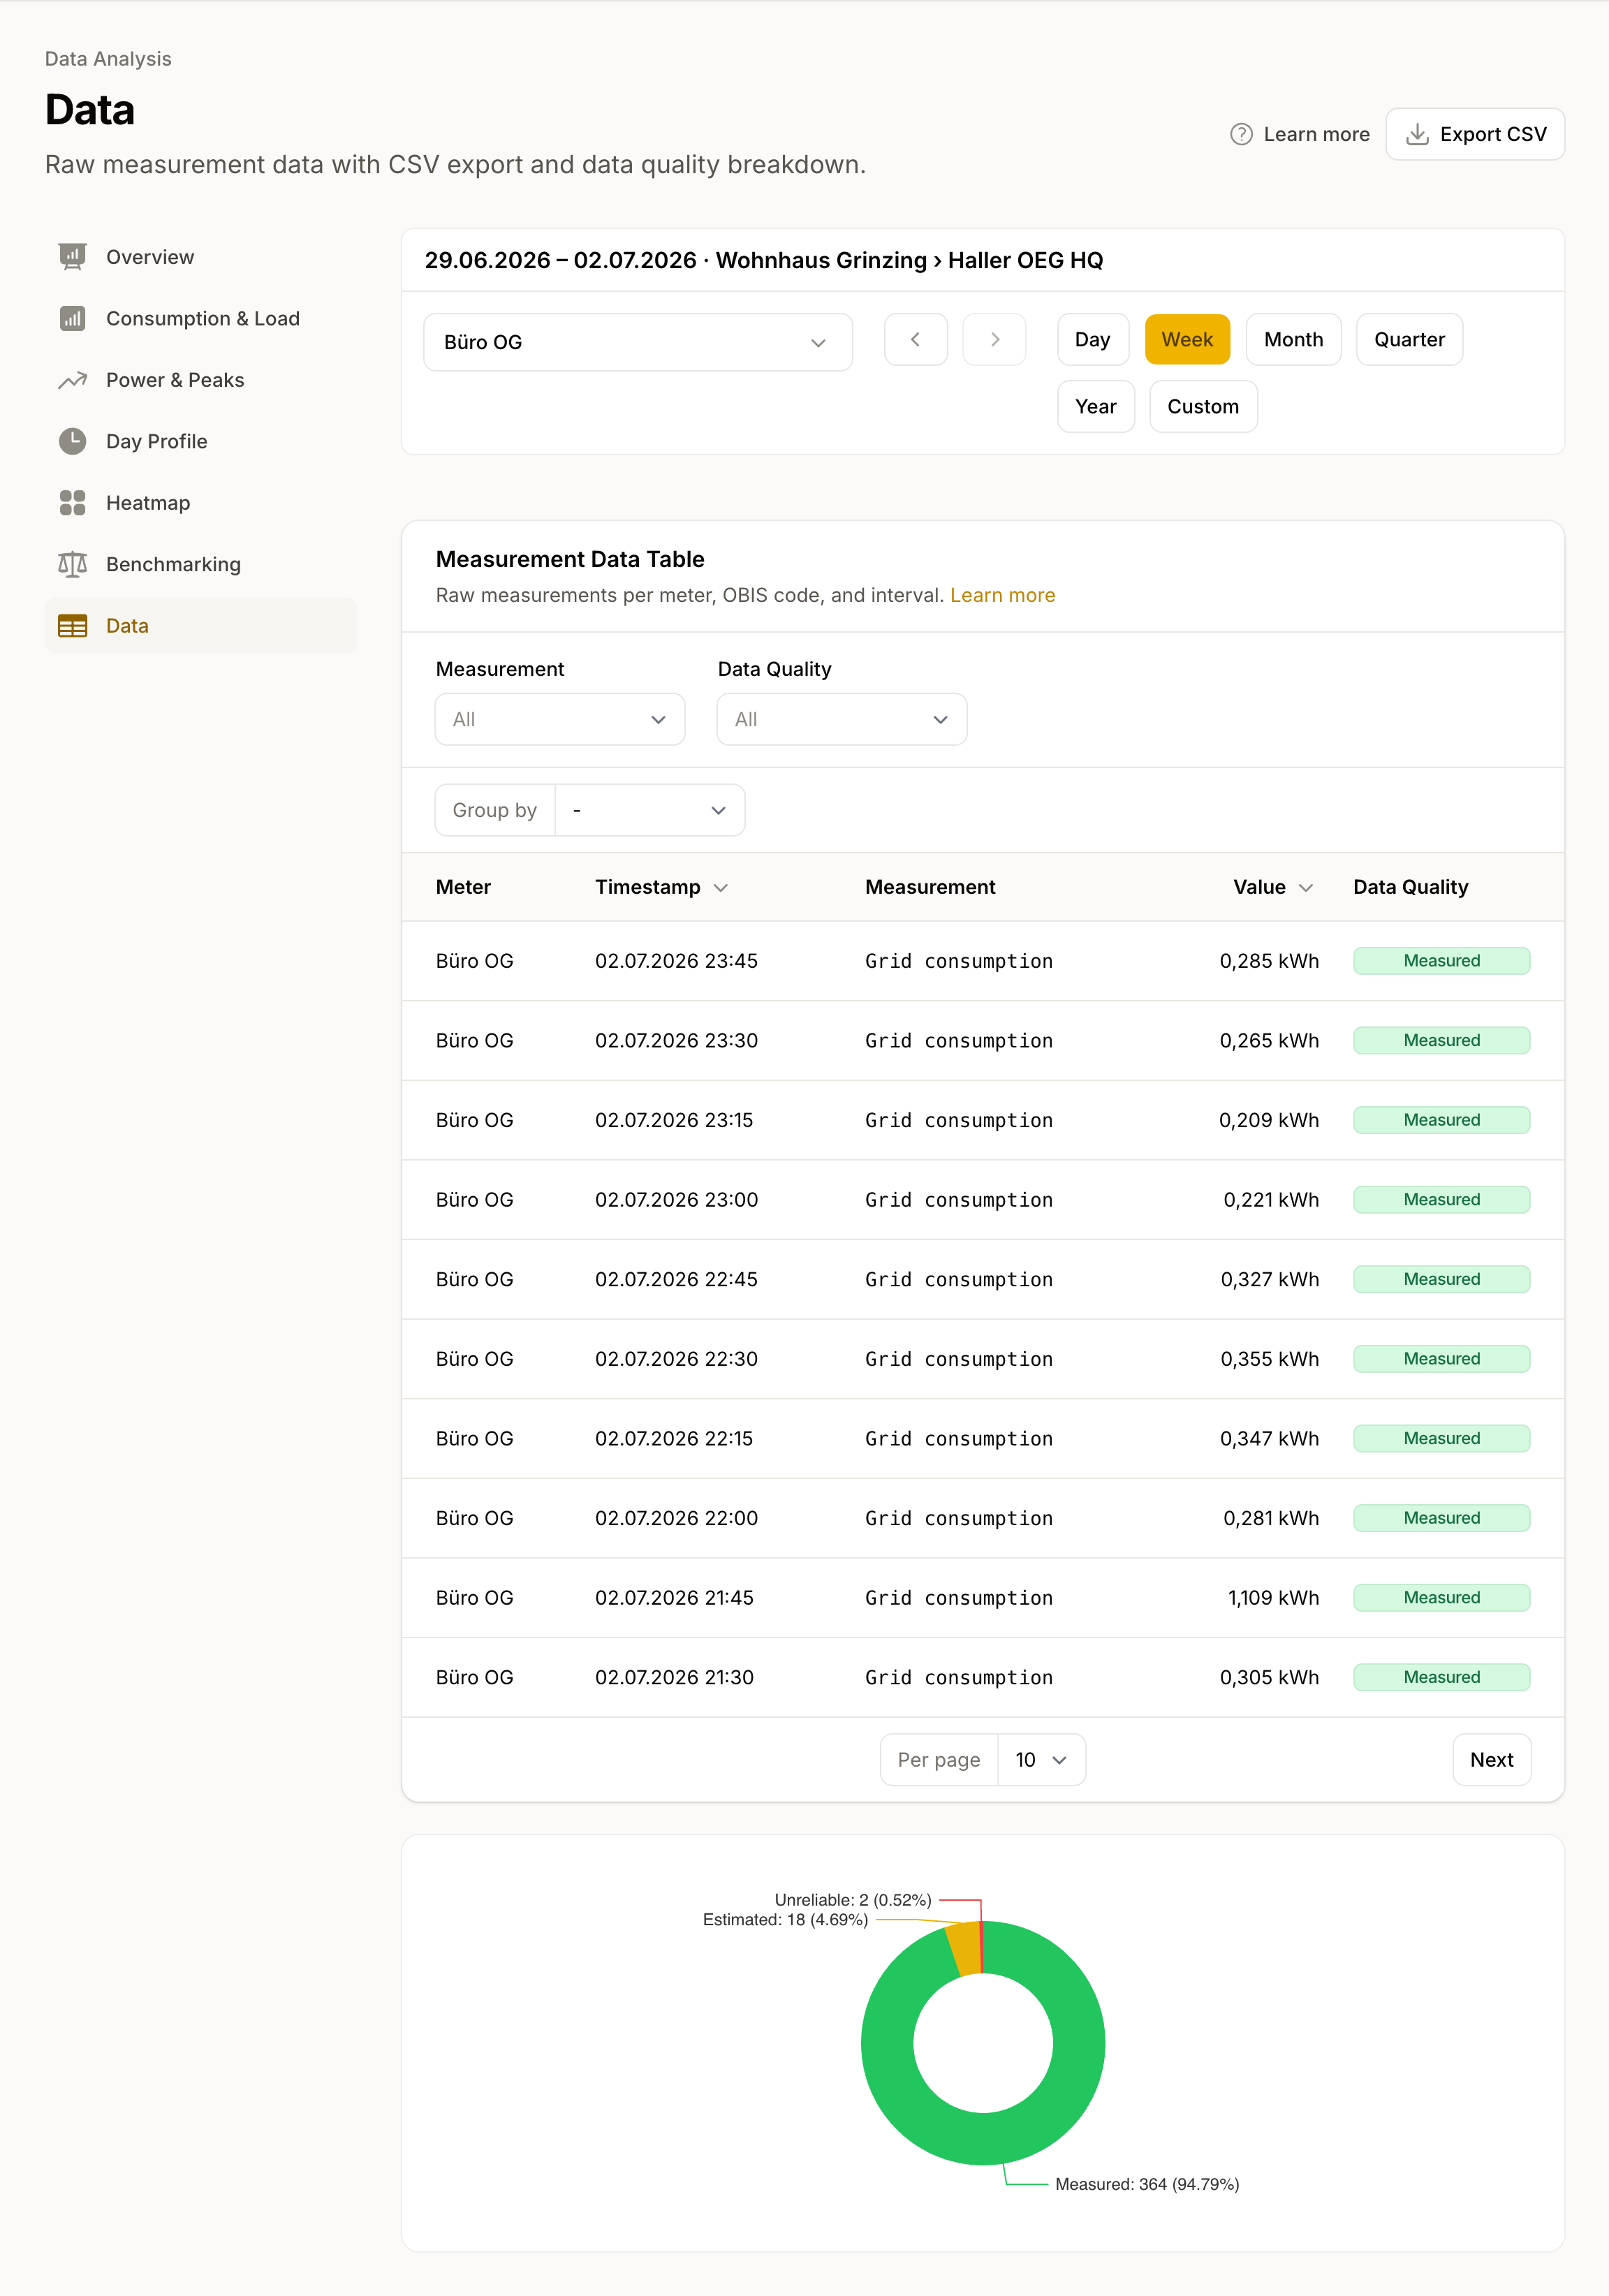
Check values and take them with you
Values arrive here, answers appear here
140+ grid operators via the EDA network
How the connection works →
energiedaten.at
Values arrive daily, carry their quality level and are ready in every view.
Base load & peaks
Load duration curve and top peaks under Power
Patterns
Heatmap and Day Profile
Benchmarking
Comparison of consumption data against APCS standard load profiles
Raw data & quality
Every quarter-hour with its quality level
Export
CSV for the selected period
Your systems
More about integrations →
True in every view:
One meter, one site, or the whole portfolio
With AI connections (MCP), you can ask your assistant about a site's consumption. Ask for the largest peaks with their timestamps and metering points to examine before a client meeting.
You switch the resolution on Consumption between 15 minutes, hourly, daily and monthly, and the period comparison places the previous period, the same period last year or a custom range next to it.
Every question can also be asked for a whole location or customer: the scope picker sums up all metering points of the selected level, and the Overview shows all connected metering points at a glance. You create locations and customers in Portfolio management.
Feed-in metering points, for example of a PV system, flow through the same views: the toggle switches between consumption and feed-in per metering point. Benchmarking compares consumption data against APCS standard load profiles (Austria's reference load profiles for grid settlement, published by APCS) as soon as the location has a building type and the meter a load profile assignment.
Periods before the connection can be filled by a historical data request, more on that at Smart meter data. And if values should flow into other systems on a schedule, Integrations take over.
Do your energy communities match your consumption pattern?
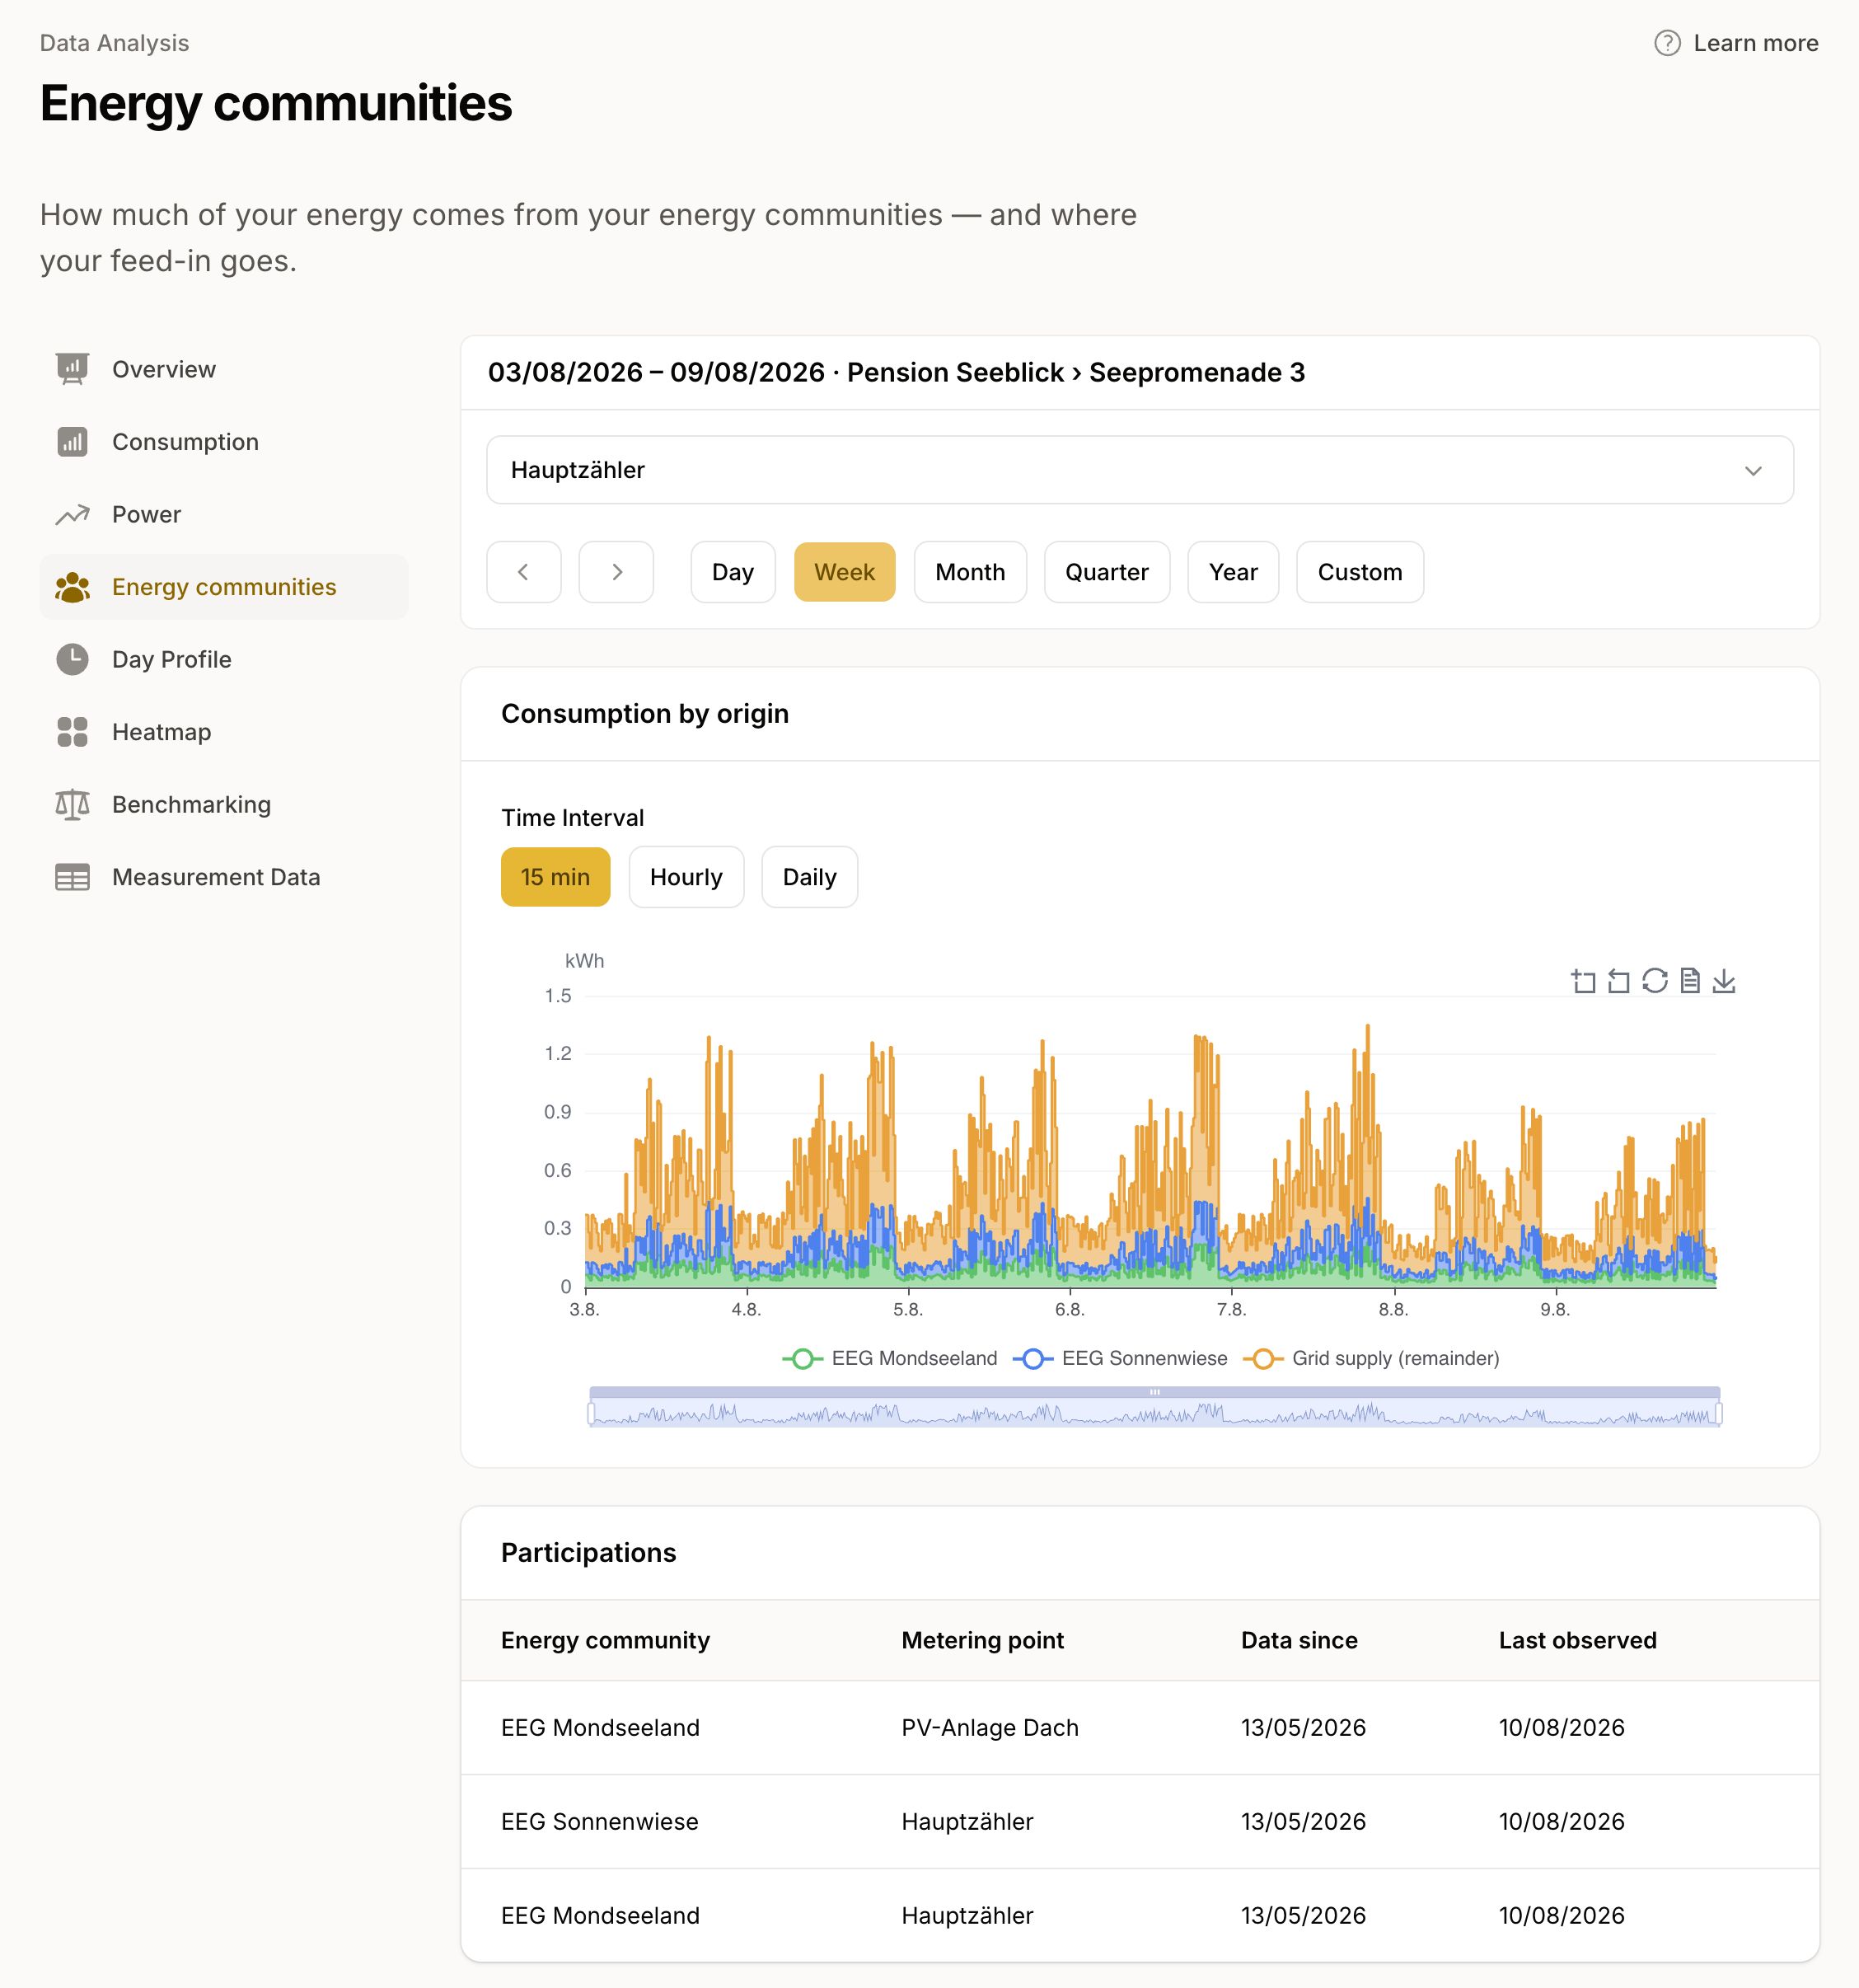
See how much electricity each of your energy communities contributes to your consumption and how much you still buy from your electricity supplier. The chart shows each community's contribution in 15-minute intervals, even when your meter participates in several communities.
If two communities mainly supply electricity at midday, you may still need electricity from your supplier in the morning and evening. Compare their contributions with your consumption: do the communities cover different times, or do their contributions fall within the same hours?
For feed-in, see how much electricity each community takes and how much surplus goes to your electricity buyer.
Every value carries its quality level
Measured, estimated or unreliable estimate: on the platform the quality level sits on every quarter-hour, and a dedicated chart on Data shows the distribution over the selected period. Grid operators must replace unreliable values with verified readings within 60 days. An analysis can improve retroactively because of this, and you always see what it is based on.
Frequently asked questions
- Does this also work for feed-in, for example a PV system?
- Yes. Feed-in metering points flow through the same views, and the toggle switches between consumption and feed-in. The analysis applies per metering point: if a meter has separate metering points for consumption and feed-in, you look at each one individually.
- Can I export the data?
- Yes, as CSV: per row timestamp, OBIS code, value, quality level and granularity, for the selected period. If files should arrive at systems or recipients on a schedule, integrations take care of that.
More features
Smart Meter Data
Daily consumption data from all 140+ Austrian grid areas. Data request, consent, 15-minute values, and a unified format from a single source.
Integrations
Smart meter electricity data in the systems your team works in: portfolio management, ERP, energy management, solar asset management, or your own dashboards.
Portfolio Management
Your whole portfolio in one workspace: read any customer or location as one curve, report per unit, and grow through file import.
AI connections (MCP)
Explore electricity consumption in your AI assistant. Compare load patterns, investigate demand peaks and connect your assistant directly from this page.
Energy data made easy
Smart meter consumption data via API, webhook, or CSV for all Austrian grid operators.
