For energy consulting
Your clients approve the data sharing once in their grid operator’s portal. You receive historical and ongoing readings for your first analysis and follow-up work, in your consulting software or in energiedaten.at.
Your clients’ meter readings
energiedaten.at
Your consulting software
CSV, XLSX or data connection
Analysis in energiedaten.at
Load profiles, daily patterns and peaks
The readings come from the grid operator responsible for the metering point, the same source as the electricity bill. Your client approves the data sharing; you manage everything else in your account.
Add your client's metering points, the 33-digit numbers on their electricity bills, and start the request.
Your client approves data sharing in their grid operator's portal.
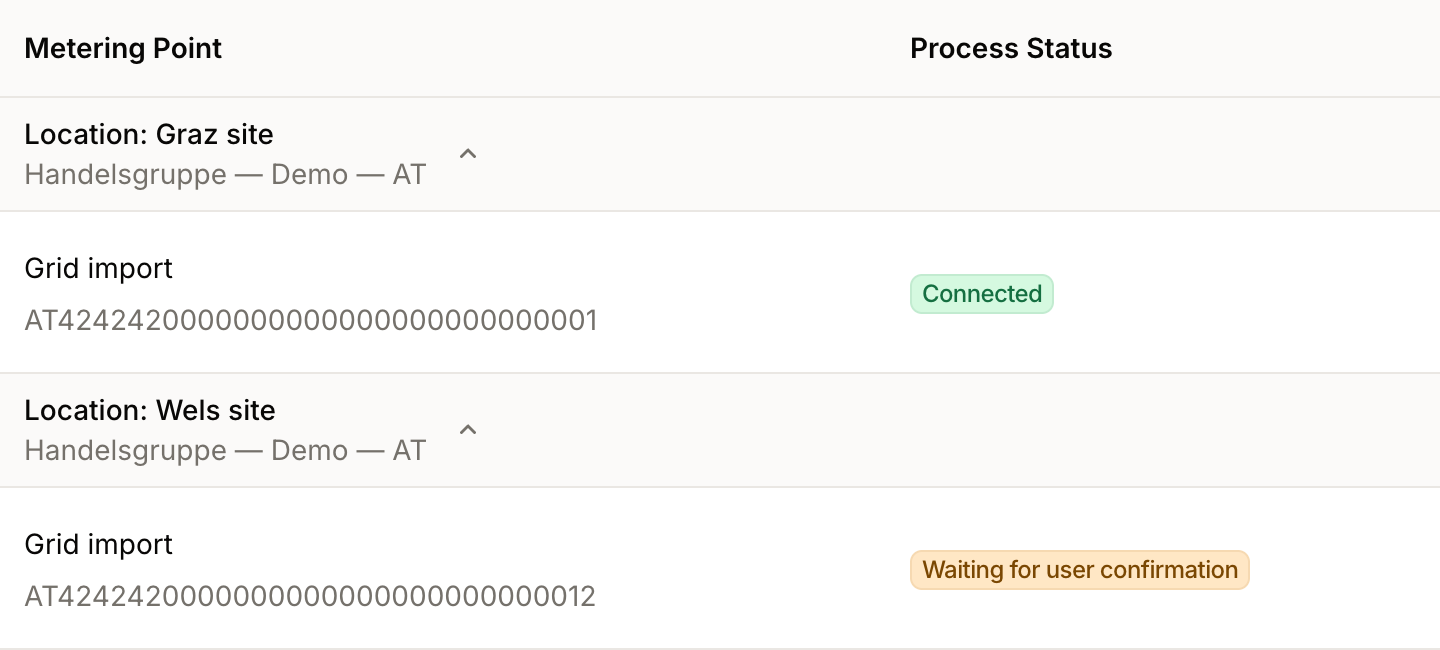
Your overview shows which connections are waiting for confirmation and which are already delivering data.
How smart meter connection works
Demo data
When connecting a meter, you can also request readings for the past one, two or three years, depending on your plan. Which readings exist depends on the metering point; older periods may arrive at daily resolution.
Compare earlier months to see whether the current load pattern is new or has occurred before.
Historical and ongoing readings
Example site · Grid import
Bring the readings into the tools you already use for analysis and client reports. Scheduled exports provide CSV or XLSX files by email; a webhook, MQTT or SFTP connection can feed the readings into your system.
Workflow illustration
Readings for your client
CSV or XLSX file, webhook or SFTP
Matched to your software's import options
Your consulting software
Your analysis and client reports
Analyse consumption and feed-in directly in energiedaten.at. Load profiles and daily patterns show when energy flows; power peaks help you discuss how heavily the grid connection is used.
Overnight demand and changes in the load profile help you identify periods for further investigation. Feed-in readings show exported energy at the grid connection. Measured values, estimates and gaps remain distinguishable.
The energy balance compares consumption and feed-in across your clients’ sites. The annual overview (preview) shows how both change month by month.
With the peak loads report (preview), compare monthly power peaks in kW for each consumption and feed-in metering point.
For clients who participate in energy communities, see how much each community contributes to consumption or receives from feed-in.
Connect the AI assistant you already use via MCP. Ask which sites used the most electricity last month or how overnight demand changed, and use the answers for your analysis.
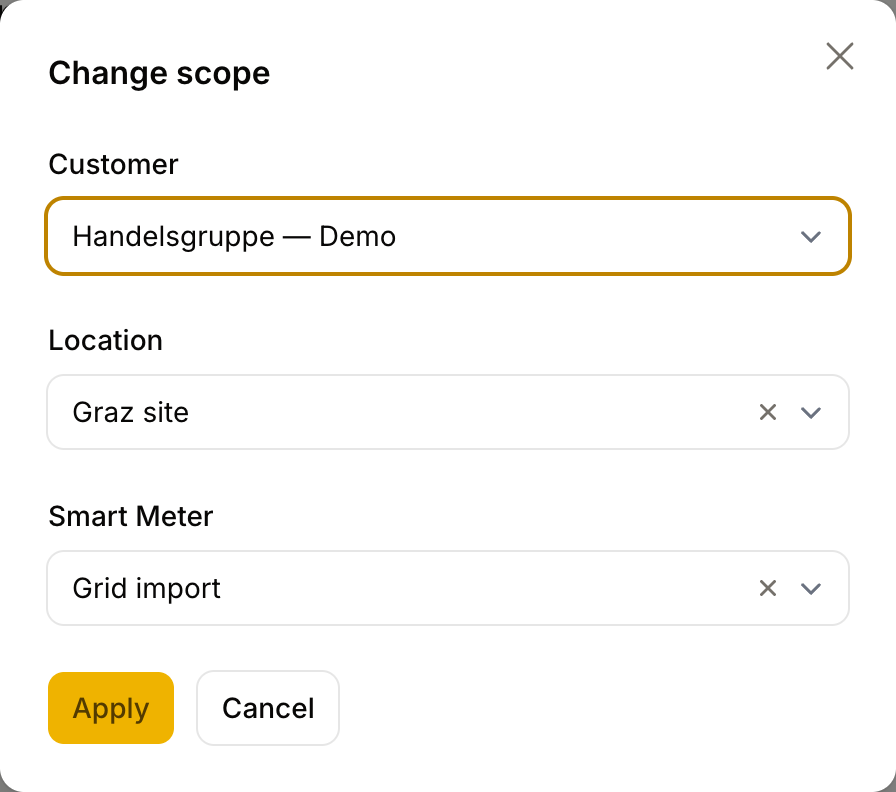
How to connect your assistantGroup metering points by client and site. Select a client to see the relevant buildings and assemble the readings for your engagement.
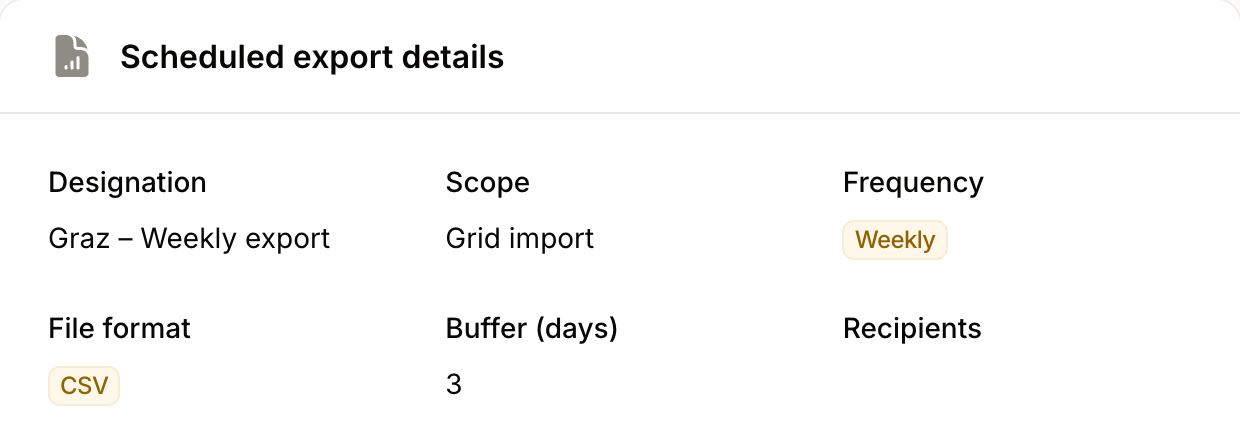
For recurring analysis, schedule an export for a meter, site or client. The selected recipients receive the file by email after the period has closed.
Use the file in your spreadsheet or consulting software for your next analysis.
FAQ
No. You manage their metering points in your account.
Once your client approves in the grid operator’s portal, the approval is confirmed within seconds to hours. The first readings follow within one to five working days, depending on the grid operator. From then on, each day’s readings arrive the following day.
Tell us which consulting software you use. We can check whether it can import the readings through a file or data connection.
The readings show electricity imported and fed in at the grid connection. Electricity from a PV system that is consumed within the building is not included as grid import. To determine total building consumption, you need additional data, for example from the PV system.
The data coverage view shows missing days and distinguishes measured values from estimates. energiedaten.at requests missing days from ongoing deliveries again. Delivery timing depends on the grid operator.
Grouping metering points by client, the peak analysis and the peak loads report are included from the Plus plan; grouping by site starts with Light. Current prices are on the pricing page.
Both are live for customers on the relevant plan. We may still change them, remove them or assign them to a different plan later. Your readings and exports are not affected.
In energiedaten.at, you can send a consent revocation to the grid operator for the metering point concerned. The connection status shows when the grid operator has confirmed the disconnection. Your client can also revoke consent in their grid operator's portal.
Manage your clients’ readings centrally and use them in your consulting software or directly in energiedaten.at.
Try energiedaten.atSee plans and prices Discuss your first client project with us.
Lieber Deutsch?